Phillip Freeman, Teacher, Richmond Secondary School, Richmond, B.C., Executive Member at Large BCAPT freeman@sphericalcows.net
The diffraction of light limits the resolution of optical systems. This is relevant in a number of real world cases, from the reason you can’t actually zoom in infinitely to read the license plate of the get-away car on the crime drama, to the limit to how small an insect a bat can ‘see’ with echolocation to the current plans for the Event Horizon Telescope. It is possible to observe single slit diffraction and resolution directly with very simple equipment.
All the materials for this should be in the school or easily obtained from a dollar store. You will need index cards, a paper cutter (which only the teacher need use), tape, and some penlights from a dollar store.
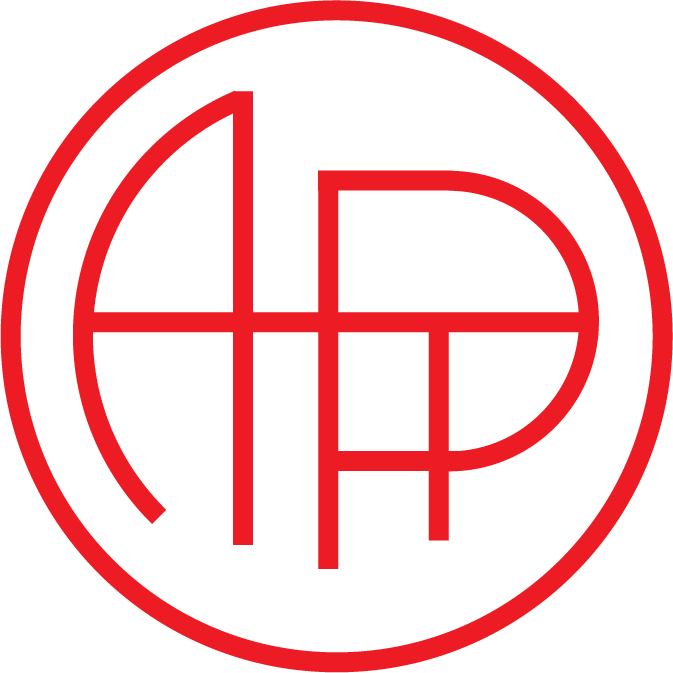
To create the slit the teacher can use a paper cutter to cut a slip about 3/4 of the way through a number of index cards (I prefer the larger size index card but it doesn’t really matter). This cut must be very clean, and in my experience scissors do not do a good enough job.
Students can complete the task by opening the top of the cut by pulling it apart sideways about one millimeter or a little more (about the thickness of a dime) and tape across just the very top to hold the width constant. This can be done by one person but is easier with two! One wants to minimize the twist in the card (some is inevitable).
The final card has a slit that begins quite wide and tapers to a point at the bottom. With this we can observe the effects of single slit diffraction and in particular directly observe the resolution of two sources of light.
Single slit diffraction:
By shining a laser through the slit and moving it up and down a single slit diffraction pattern can be projected onto a screen.
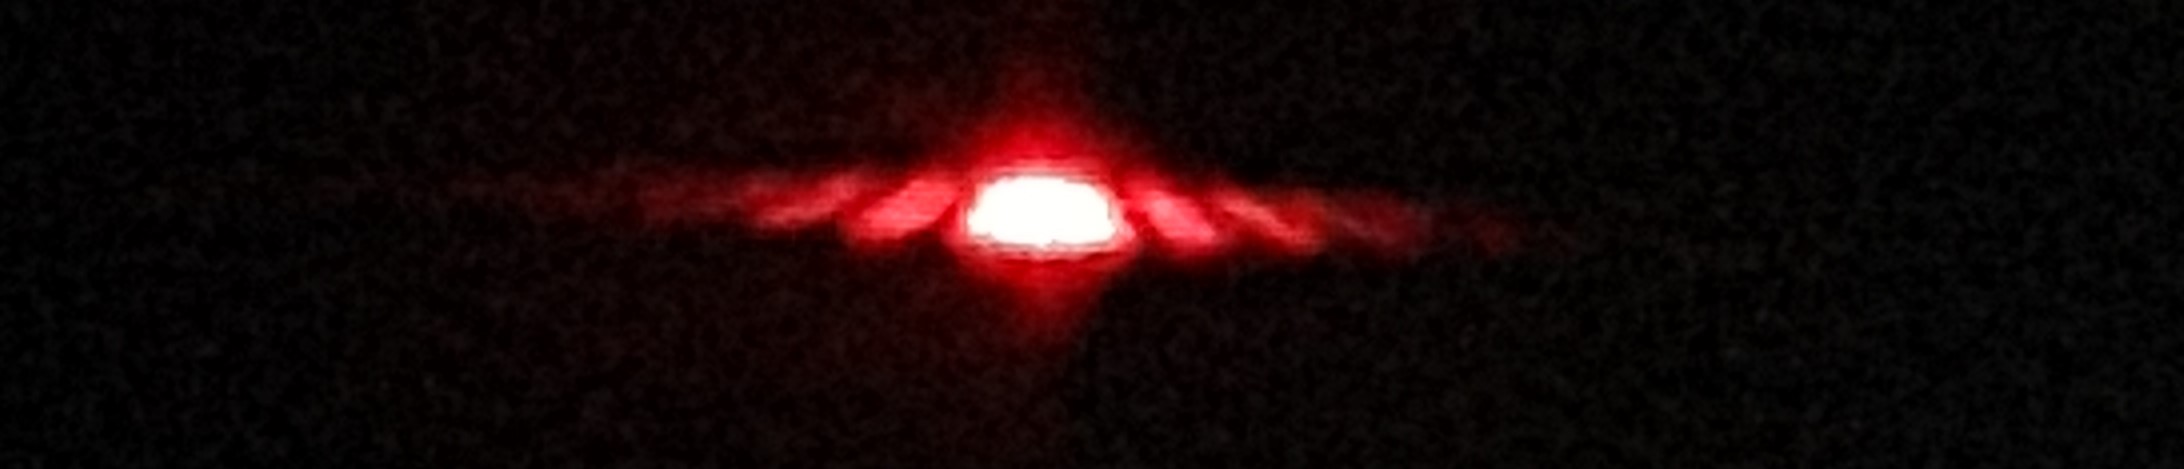
But this apparatus is even better when used for direct observation, and it can be linked to optics more easily that way. The teacher should place two small flashlights at the front of the room. I find that dollar store flashlights with a single white LED work well. The lights must have a switch that lets them stay on when turned on:
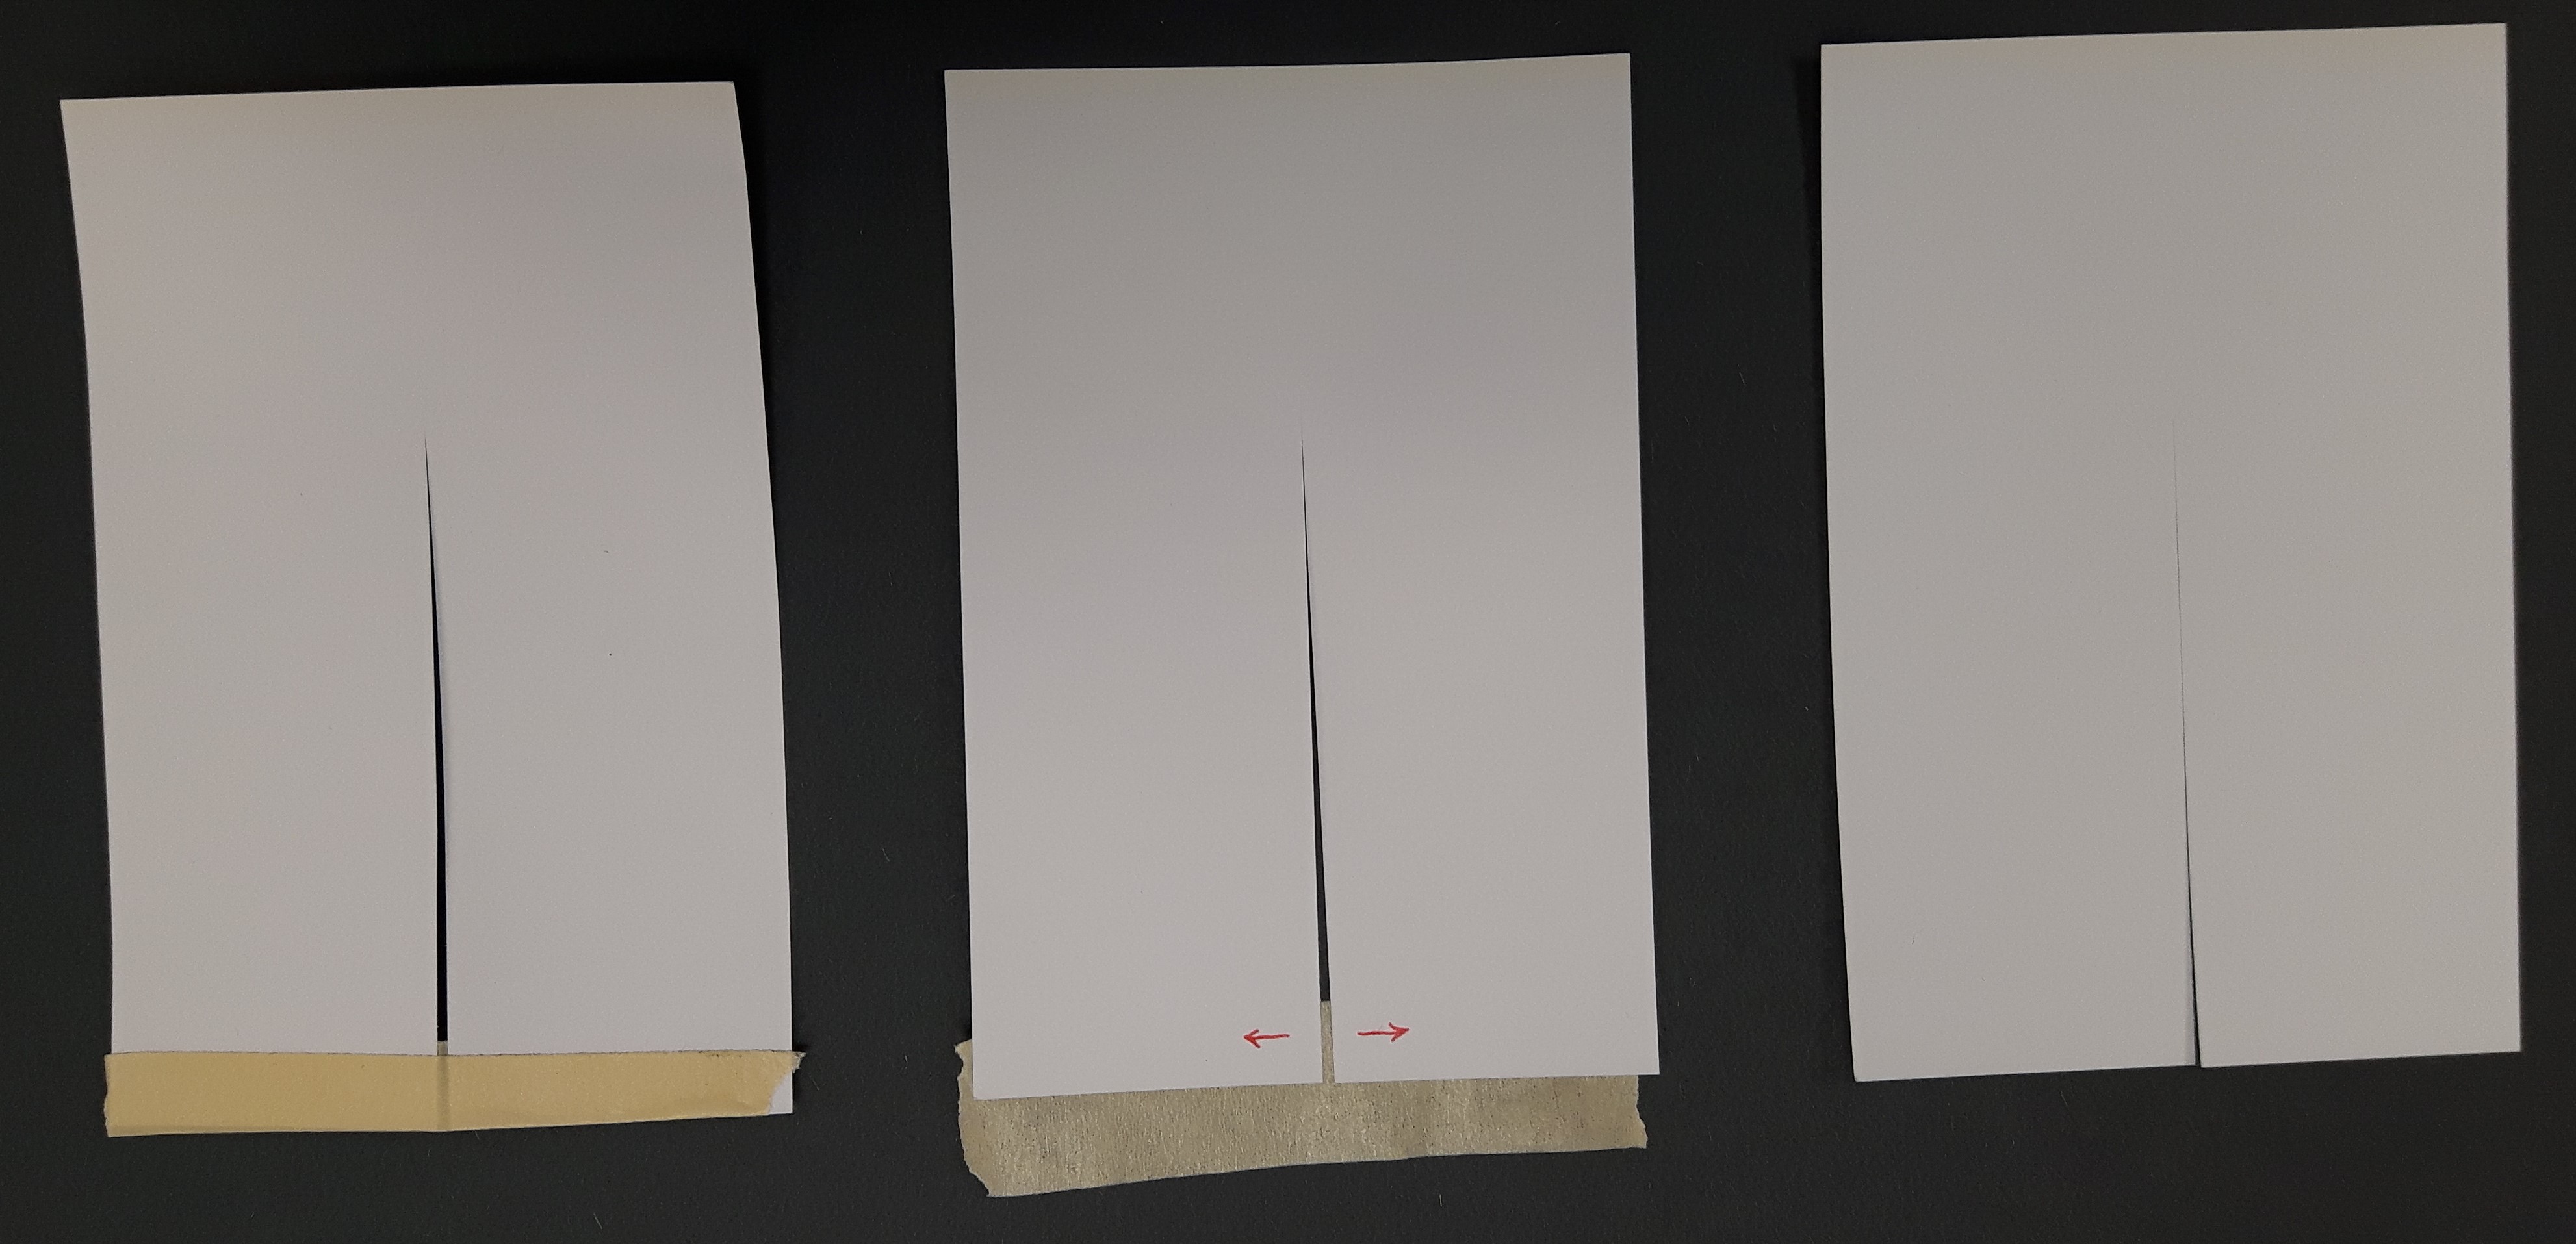
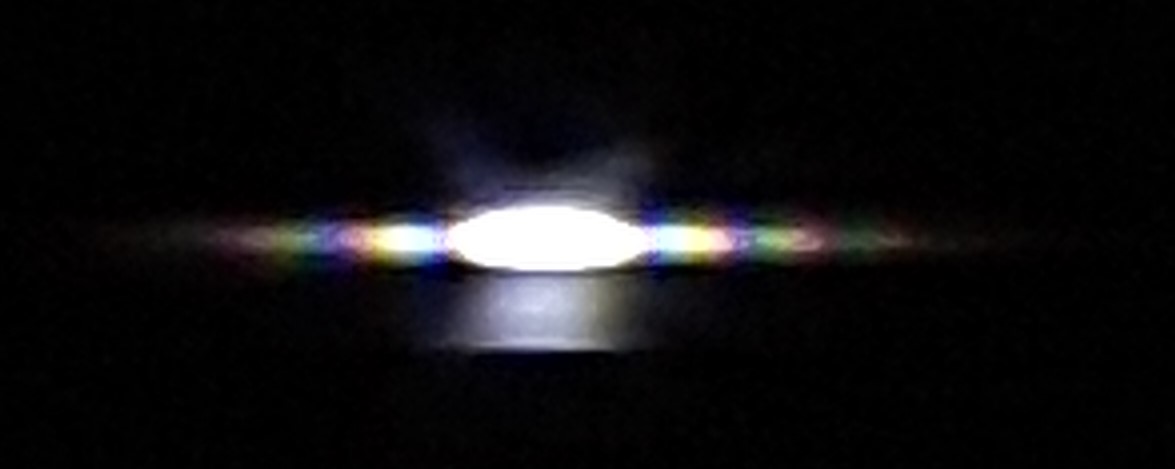
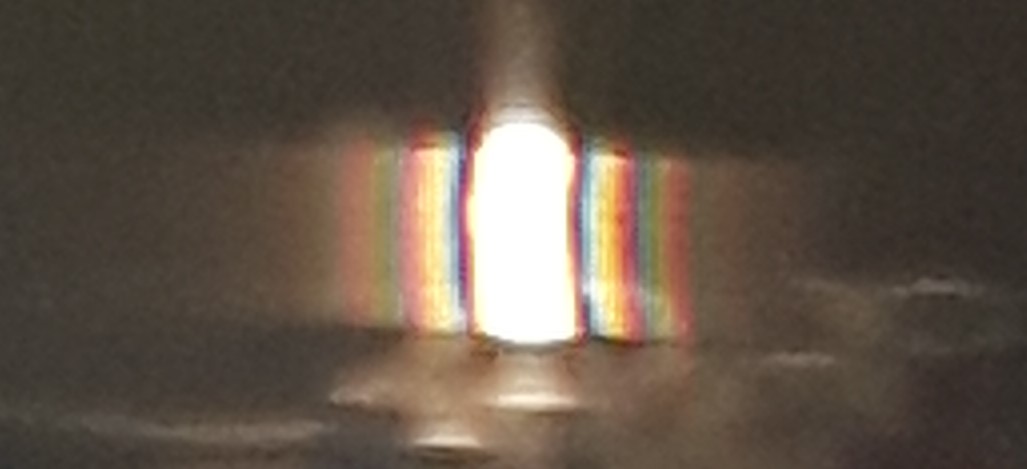
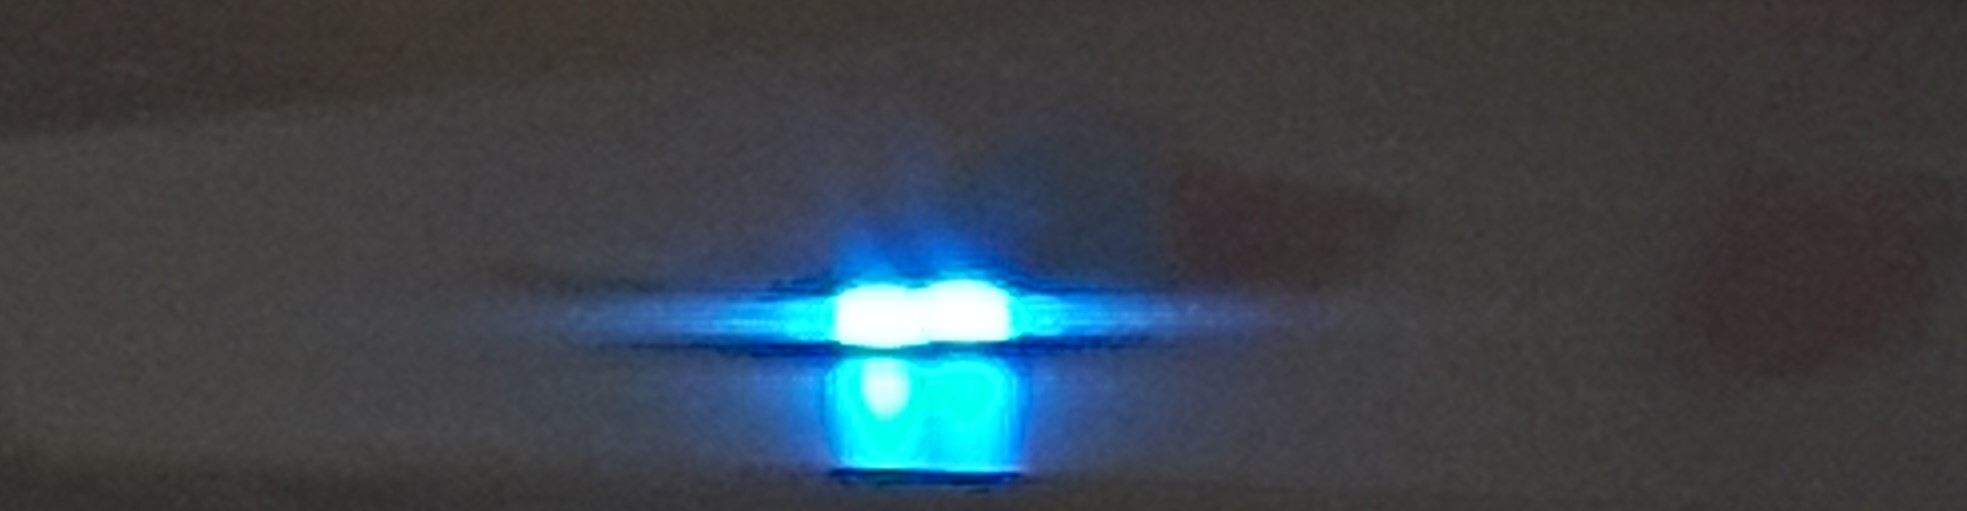
The teacher begins by turning on one flashlight. The students should hold up the card, gripping it lightly at the top so that it does not flex or pull the slit open more. The student should look at the light through the slit, beginning with the top of the slit and then raising the card so as to look through a narrower and narrower slit. When they do so they will see the light clearly at first, then increasingly diffracted. Coloured fringes can be observed:
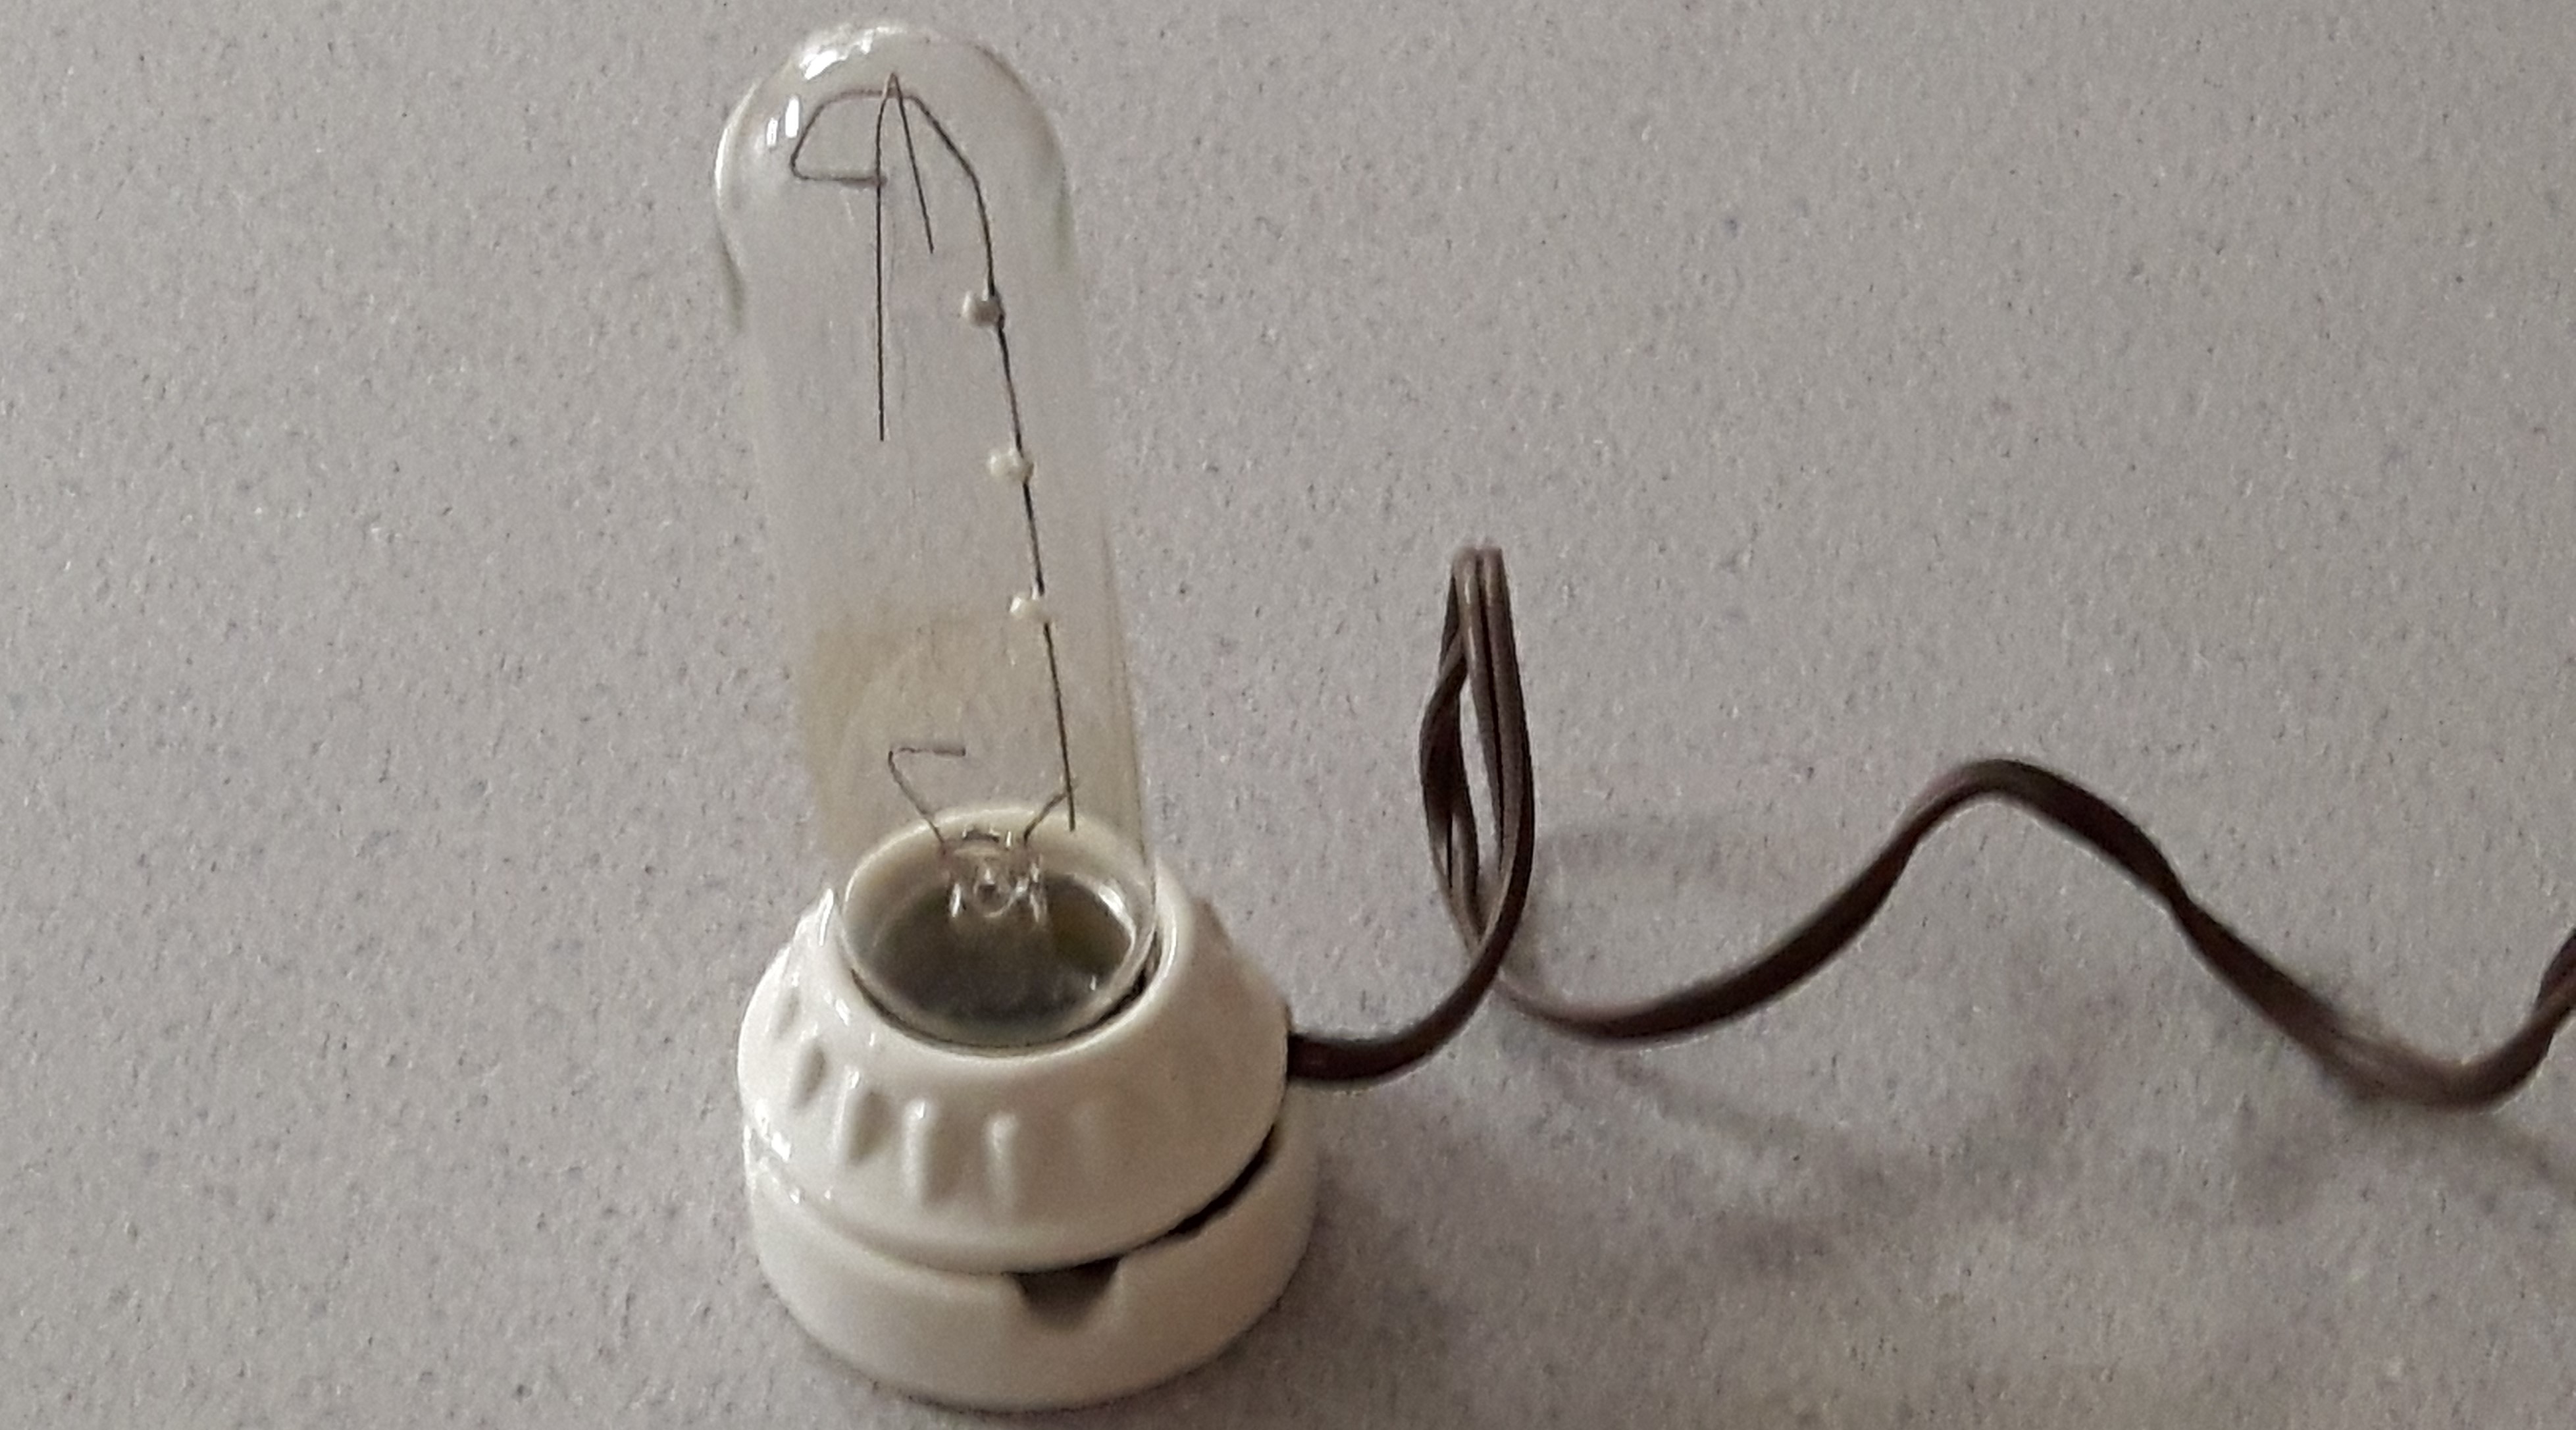
Note that the blue is on the inside, and red is on the outside of these fringes. If you have a long filament bulb, like a fish tank bulb, these produce even better fringes for this part of the demo.
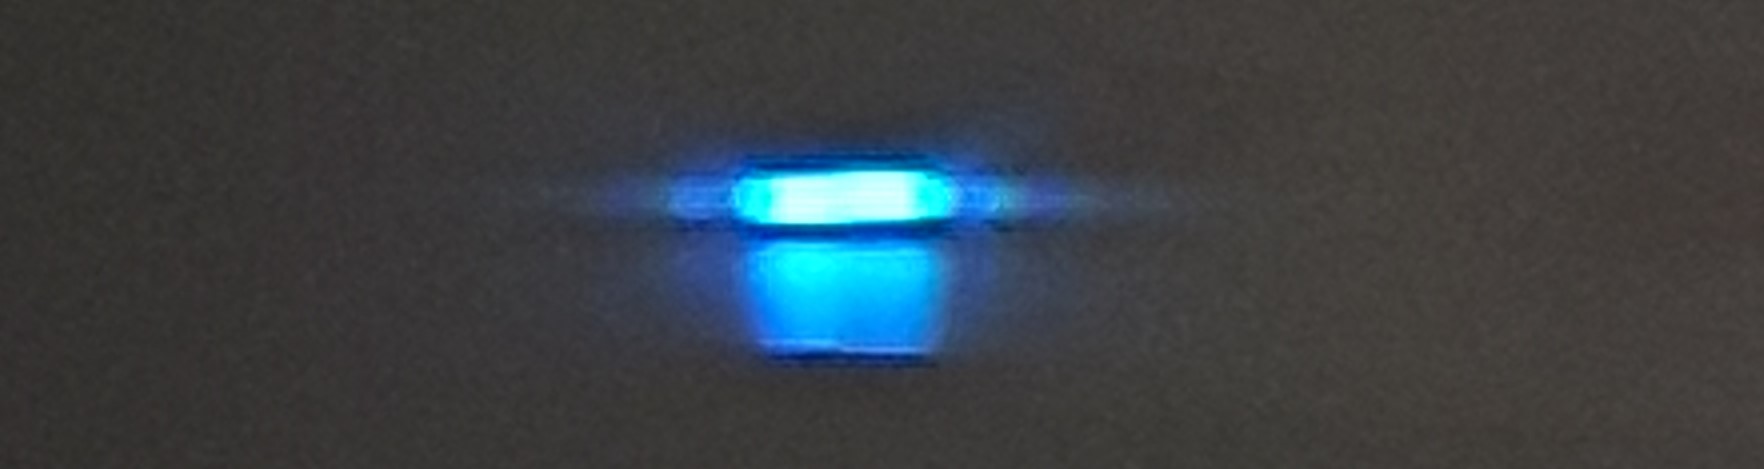
Students should observe how the pattern changes as the slit is wider and narrower, finally blurring out almost entirely when the slit becomes really narrow.
Resolution: Now that the student has observed diffraction through an opening, they can see how it affects the ability to distinguish two sources of light. To do this the teacher turns on the two lights and puts them close together side by side at the front of the room (a pen or pencil can be placed between them to create consistent spacing). I find that using some cellophane as a coloured filter makes seeing the effect clearer.
Students again observe first through the wide part of the slit (clearly seeing two sources), then slowly raise the card so that they can see the effect of narrower and narrower openings on the ability to resolve the lights:
The effect of wavelength can be qualitatively observed, but unfortunately I have not found that the slits are stable enough (or clean enough) for quantitative work.
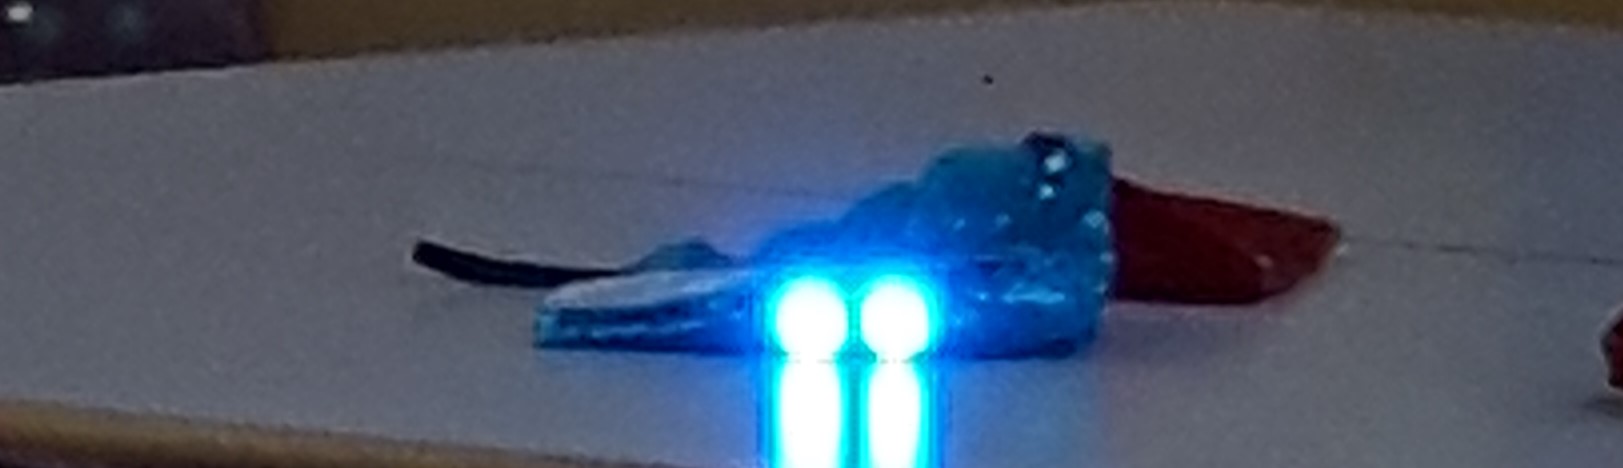
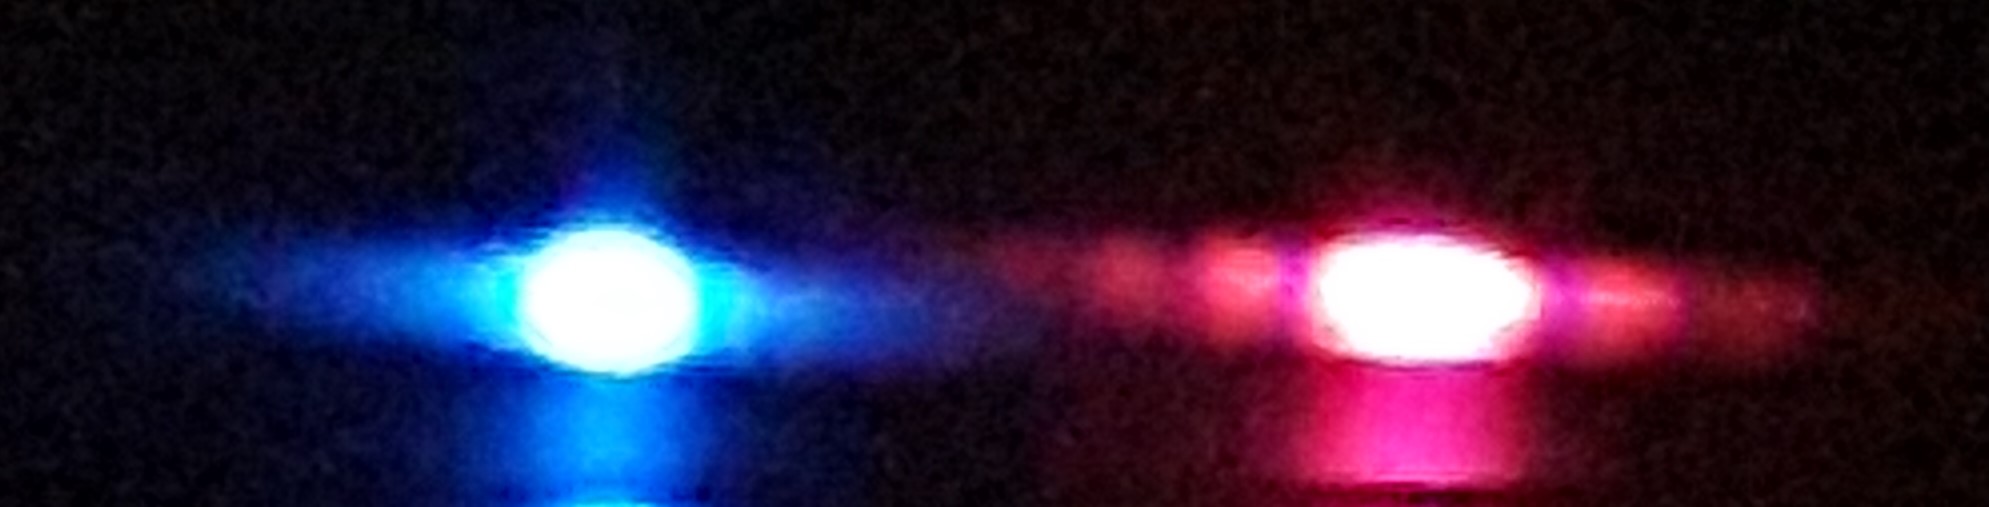
To see the effects of wavelength wrap each light in a different colour of cellophane (red and blue or red and violet work best). Put them near one another (but farther apart than with the resolution demo) and again observe through the slit, moving down until the diffraction pattern can be clearly seen:
While the effect is not glaring, the fact that the blue light has more closely spaced fringes than the red can be observed. Placing one on top of the other makes a clearer comparison, but the changing width of the slit complicates this.
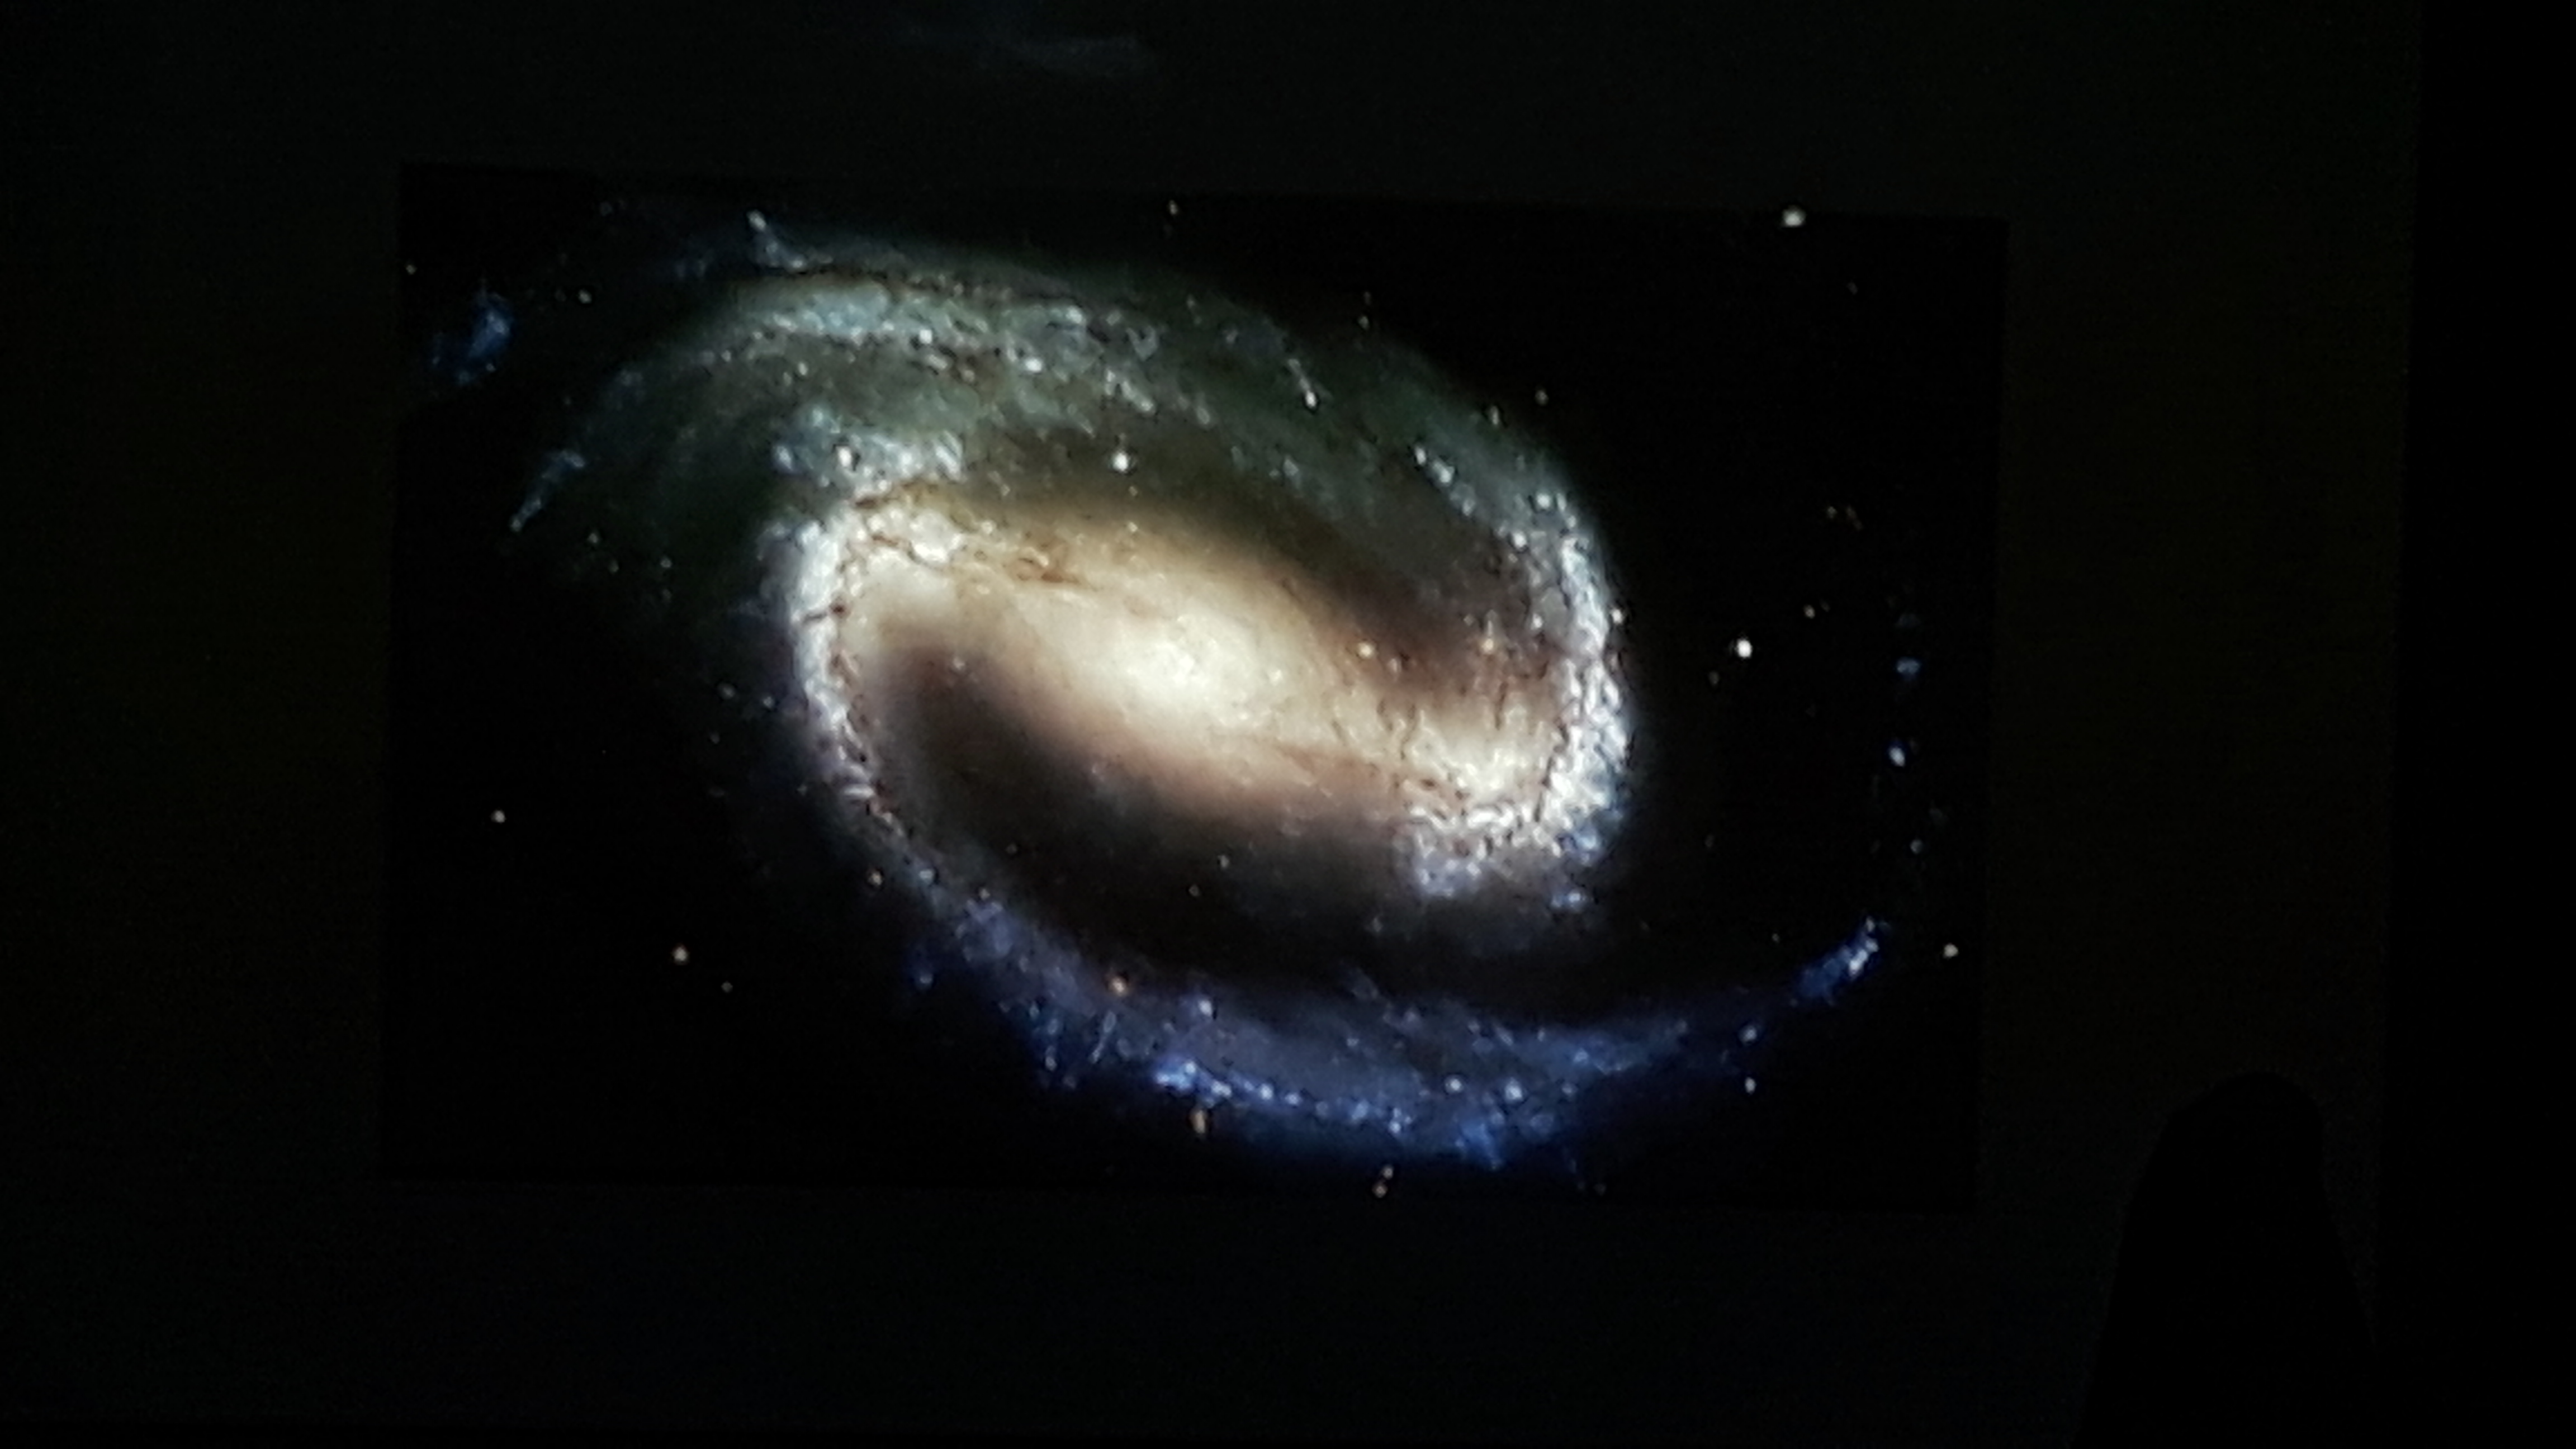
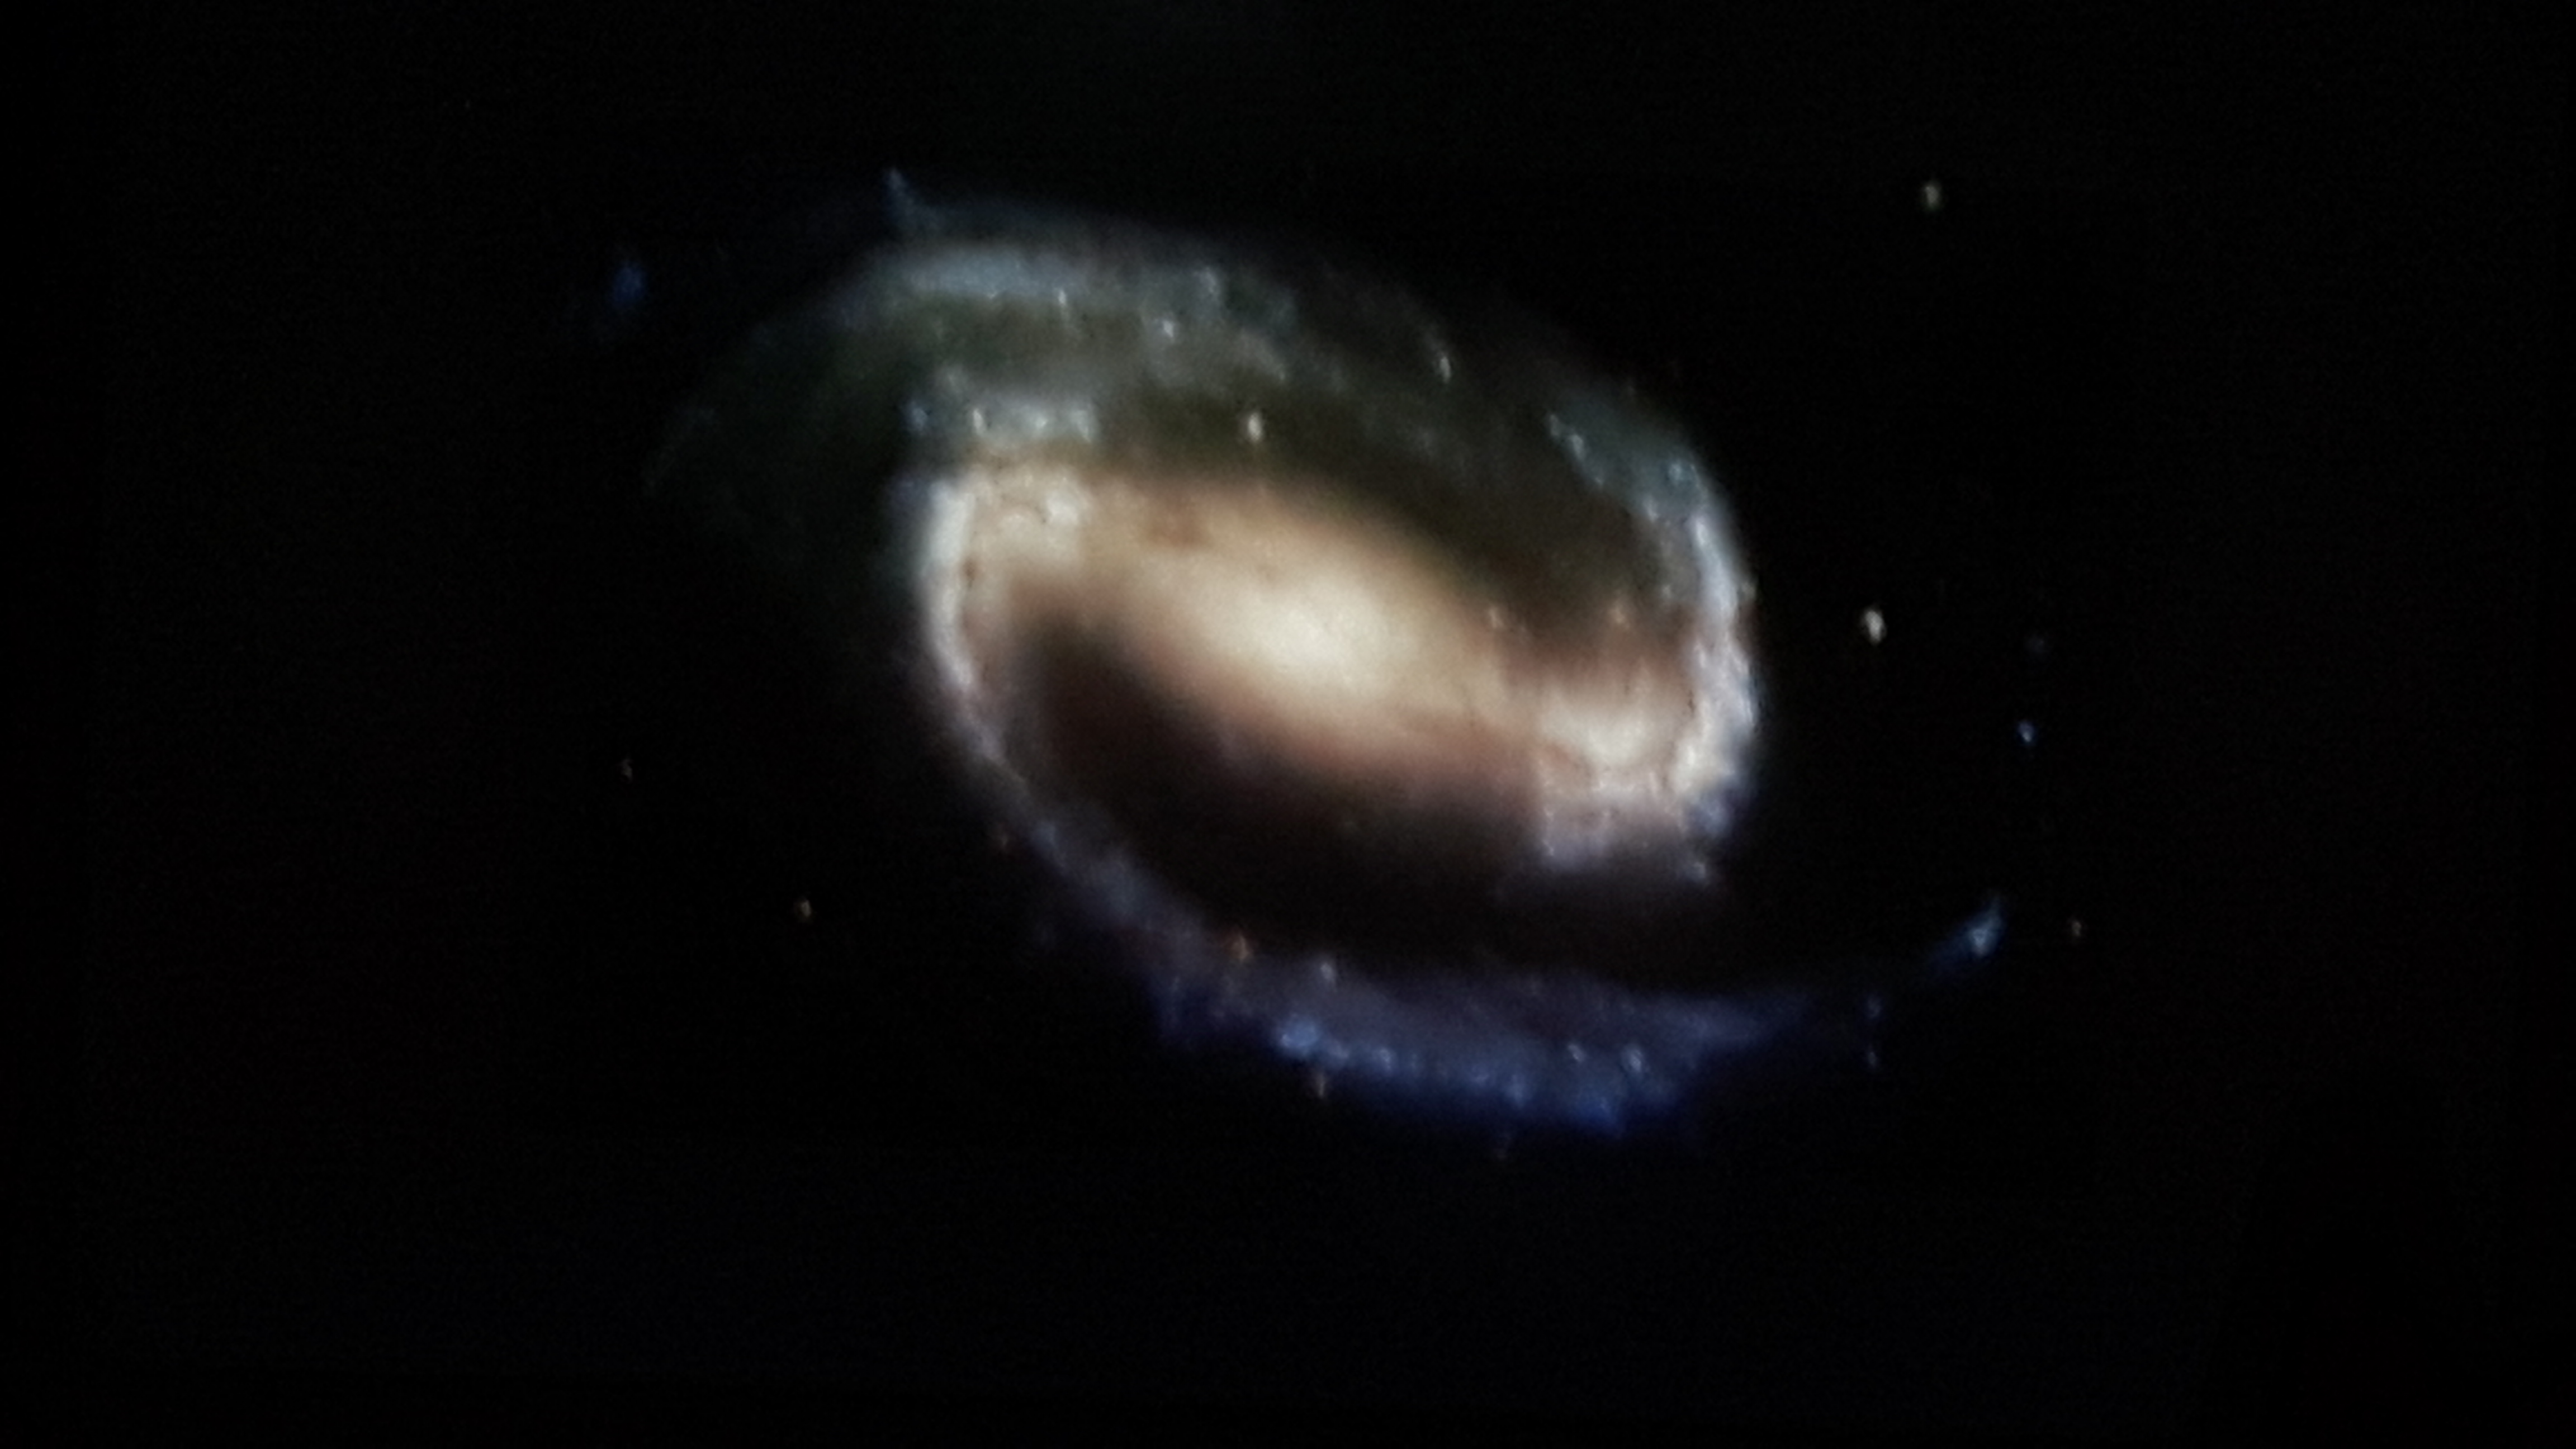
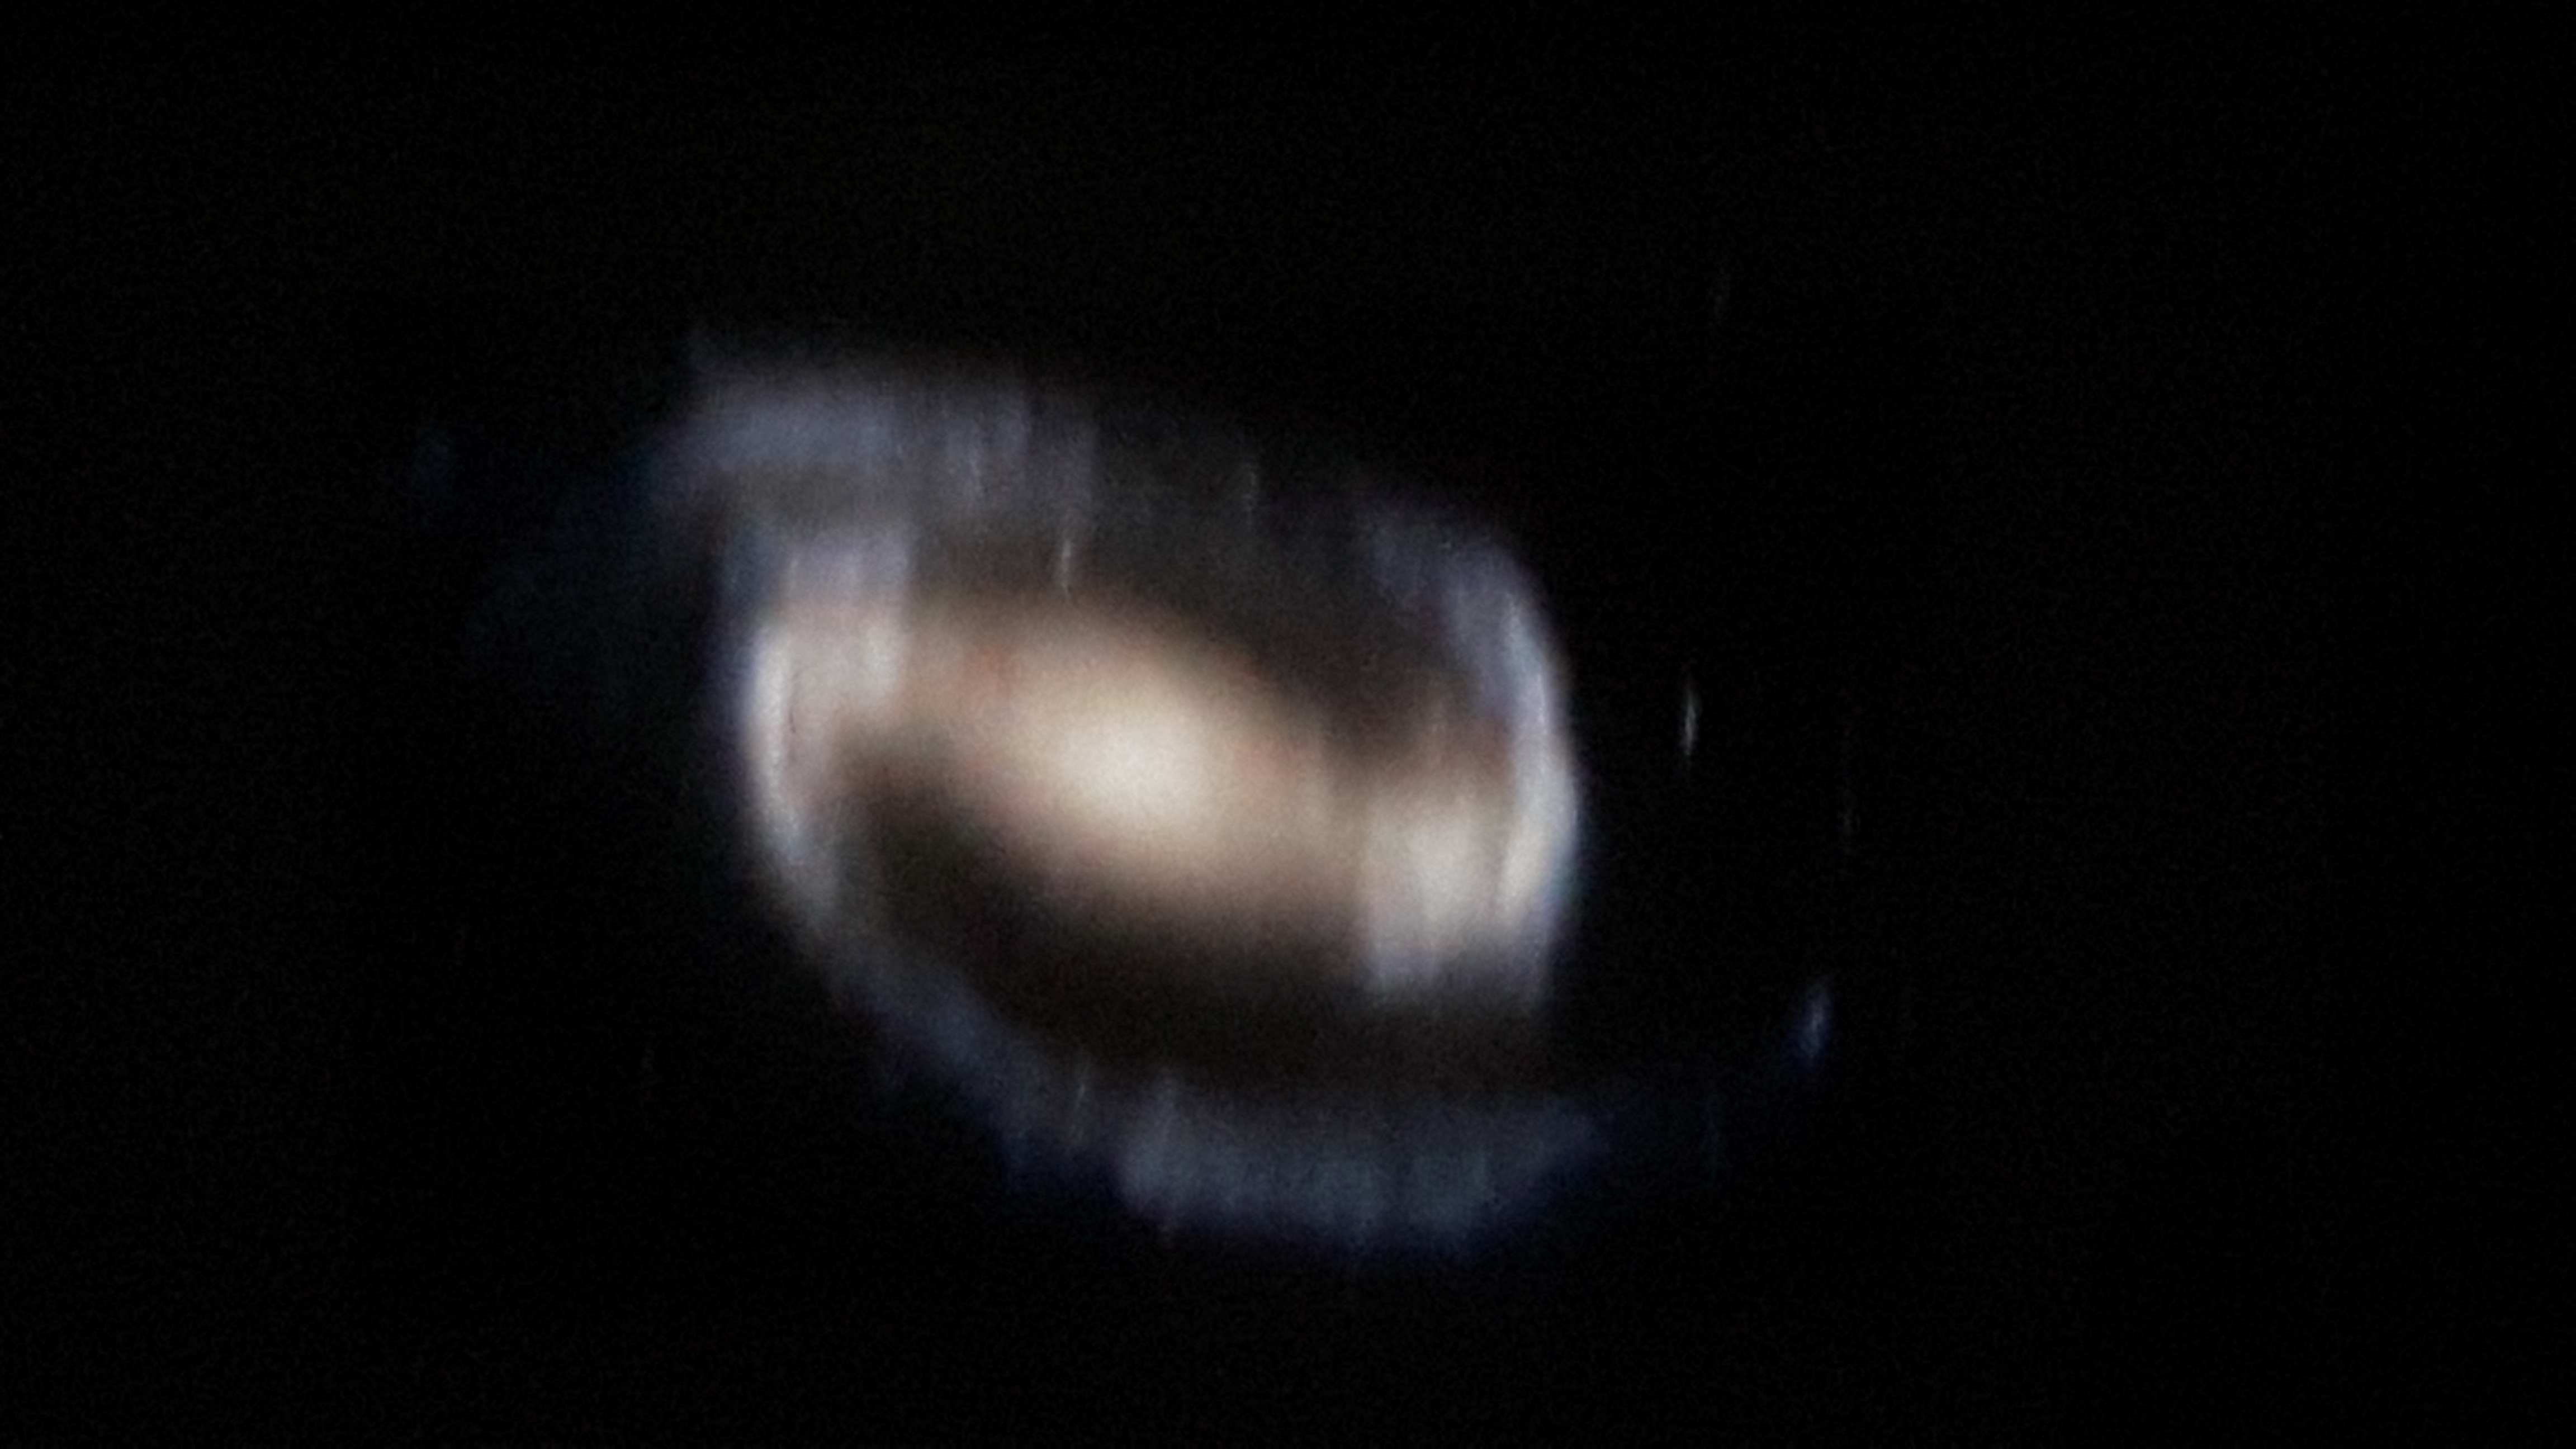
Telescopes (and microscopes) and the diffraction limit The effects of resolution can be seen by looking at an image through the slit as well. Here is a Hubble picture of Barred Spiral Galaxy NGC 1300 was projected from my classroom projector onto my whiteboard, as seen through narrower and narrower slits. These pictures were taken holding the slit across the lens of a cell phone camera. Students can see this effect with fewer complications from exposure etc. when they view it through the slit.
Credit: NASA, ESA, and The Hubble Heritage Team (STScI/AURA) Acknowledgment: P. Knezek (WIYN)
A great video on optical limits is the Minute Physics video “How Far Can Legolas See”:
Astronomical Interferometry If we have blurry images from two telescopes that some distance apart, we can use interference to combine the images and achieve a resolution as if the “width of our slit” was the distance between the two telescopes! Unfortunately I haven’t found a simple way to explain how that is done… I would really value any suggestions on how to show the physics behind this, at least reasonably enough to convey the basic principle and be less hand-wavy / ‘magic’!