Timothy Sibbald, OCT, associate professor, Schulich School of Education, Nipissing University, North Bay.
timothys@nipissingu.ca
Tiberiu Veres, teacher candidate, Schulich School of Education, Nipissing University, North Bay.
tib.veres@gmail.com
Michael Anderson, teacher candidate, Schulich School of Education, Nipissing University, North Bay.
mdanderson384@community.nipissingu.ca
Newton’s cradle is a classic physics ‘toy’ that is interpreted as showing the conservation of energy and momentum. In some respects it is too good at what it does. Students see predictability in the action that takes place and may not be driven to consider it more deeply. In essence, the instructional problem is that the cognitive dissonance that it causes can be explained fairly readily as conservation of momentum. However, like so many elements of physics, if it is tackled in the right way the richness of Newton’s cradle can be revealed.
Gavenda and Edgington (1997) suggest that Newton’s cradle is an opportunity for considerable physics investigation because it exhibits a complex behaviour. It was this complex behaviour that gave rise to an investigation within a class preparing teacher candidates for teaching in high school classrooms. In particular, an unanticipated observation was made: when a steel hammer is used to tap Newton’s cradle the five balls separate and all but the ball that was impacted begin to move.
This suggested that the behaviour might be discretized or quantized — one ball colliding causes one ball to fly off the other end, two balls colliding causes two to fly off, but a hammer that is very likely a non-integer weight of balls causes all balls, except the first, to fly off. Certainly it is evidence that conservation of momentum and energy allows more than one solution (as mentioned by Gavenda and Edgington, 1997) and that raises the question of what additional criteria determine the behaviour that will be observed.
In order to find a satisfactory explanation a couple of textbooks were consulted. They implied that it was just a matter of conservation of energy and momentum, but did not explain the behaviour differences we observed. Notably Gauld (2006) has explained this shortcomings of many physics textbooks. The academic literature provided indications that theoretical insights (Hutzler, Delaney, Weaire, & MacLeod, 2004) might be experimentally achievable within a high school classroom. Since the theoretical models they used included concepts not typically addressed in high school curricula, we focused on how to apply the scientific method to address the issue that we observed. In this way Newton’s cradle provided a specific instance where we looked at the pedagogy of teaching about the scientific method while engaging in the process to resolve our question.
The initial stage of our investigation was characterized by generating hypotheses and anticipating that one such hypothesis would explain observed behaviours. We considered simplifications of the scenario where one moving ball would collide with two stationary balls. This scenario was modeled as one mass (
M) colliding with perfect transfer to two balls, each with the same mass (
m):


The idea was that in a normal Newton’s cradle
M =
m but when tapped with a hammer this would not be the case. Solving for
v2 in the first equation and substituting in the second equation leads to:
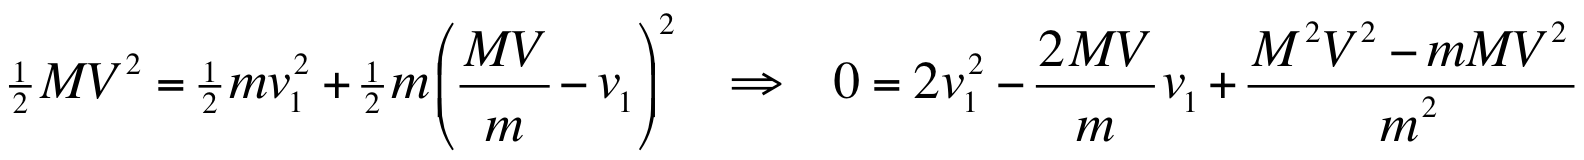

This approach is achievable in high school because techniques for solving quadratic equations are in the Grade 10 mathematics curriculum. Furthermore, with perfect energy and momentum transfer the incoming ball stops, which eliminates one of the two quadratic solutions. Thus, there should be one unique solution — except this did not match the observations.
This led to modifications of the hypotheses. What if the energy was not perfectly transferred? We considered introducing an efficiency factor to model less than perfect transfer of momentum to no avail. We also consider loss of momentum in the balls because it is observable through the noise produced in the collision. Losses were investigated using a subtractive loss (transferred momentum as
MV -
Q for some
Q of lost momentum) and a proportional loss (transferred momentum as
qMV for some
q with (1 -
q)
MV lost) without satisfaction. Additional notions were considered and debated such as a pushing model where the incoming ball effectively pushes all of the stationary balls for a brief moment leading up to the departure of a single ball. This was prompted by the notion that a hammer, even as a gentle tap, might not be stopping in the same way as a ball being released in the typical use of Newton’s cradle.
While these discussions were insightful because they required communicating different models, discussions of consequences, and identification of potential experimental variables, none were successful in clearly justifying the observed discrepant behaviours. We had an inkling that the ideas were not necessarily erroneous, but they were not obviously correct or valid. Ultimately, we designed an experiment to test the ideas to gain further insight.
An experiment with Newton’s cradle is problematic using common high school equipment. The collisions and consequences occur relatively fast. One of the students had a GoPro camera capable of 30 frames per second, but it was not sufficient to reveal the mechanism. In addition, it was suggested that there might be non-linear effects due to the pendulum motion within Newton’s cradle. As occurs with many physics problems, we needed a simpler experimental setup that would also reduce the speed of events.
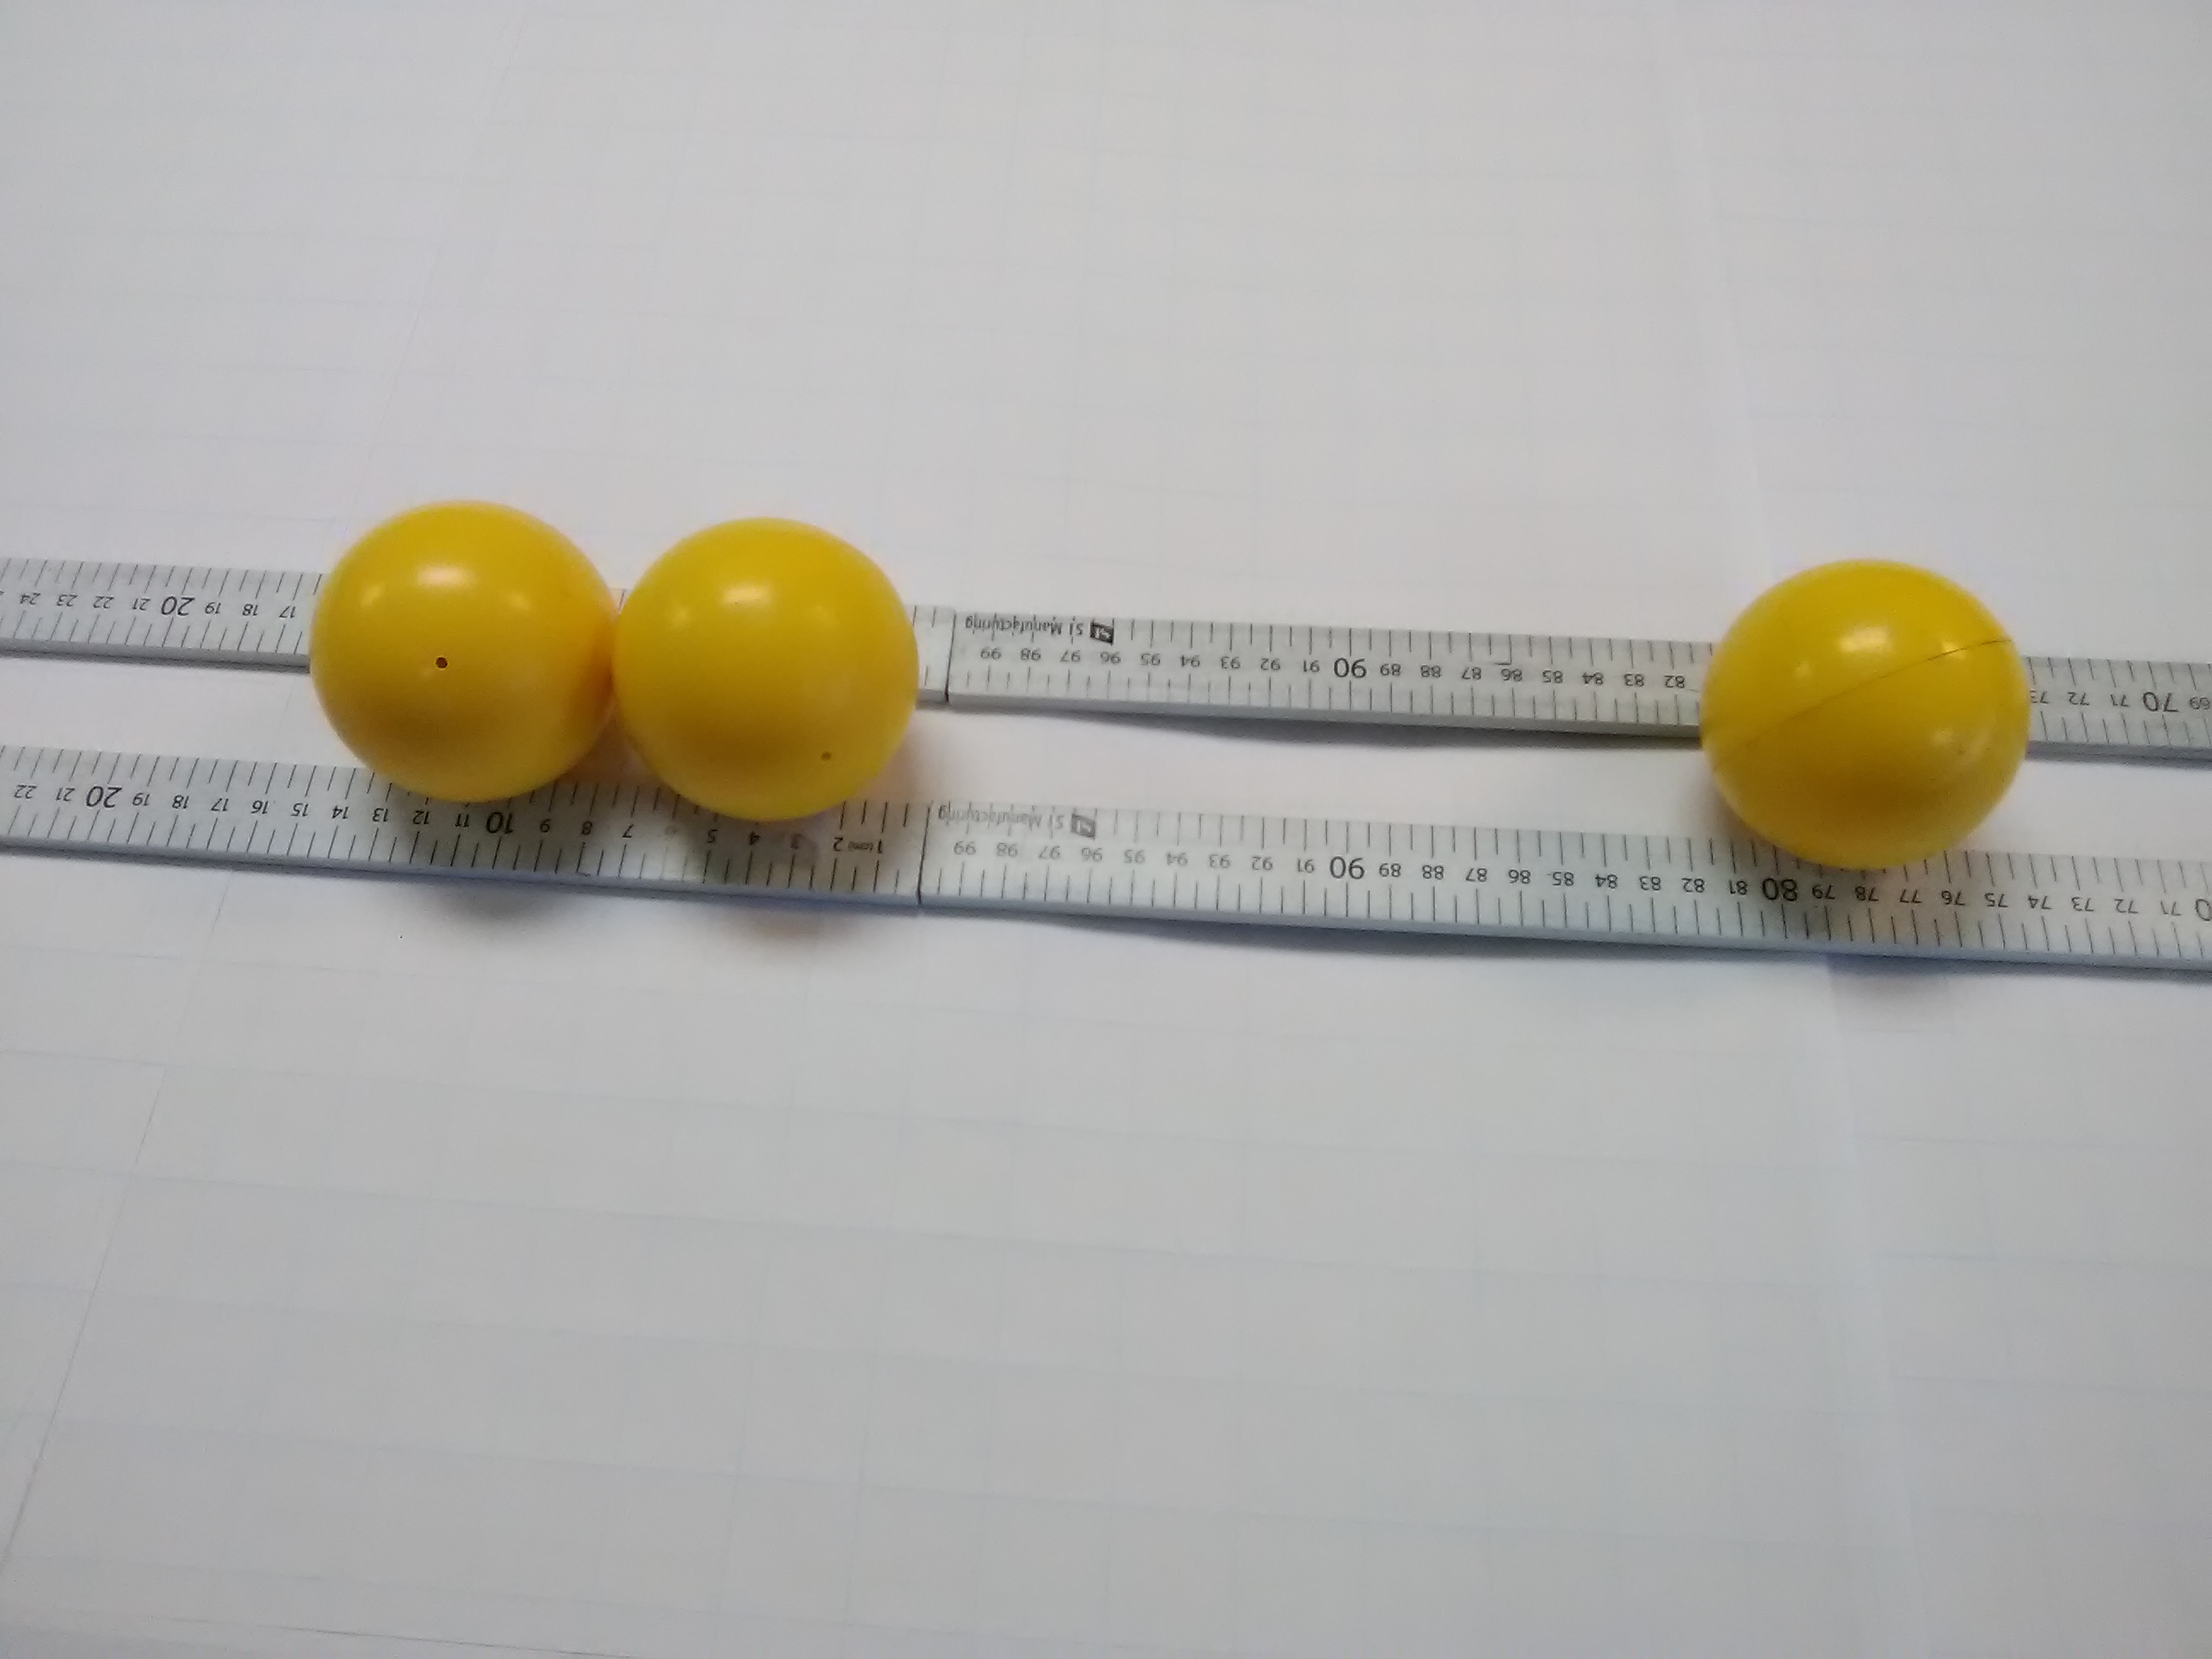 Figure 1: Experiment to investigate Newton’s cradle
An experimental design using hard two-inch diameter plastic balls was developed. It was decided that we should begin with a simple scenario of one incoming ball that would impact a pair of balls. This is shown in Figure 1 where the incoming ball is on the right having been accelerated using a hammer. A guiding track was made that was two meters long using meter sticks. This constrained the motion to be linear and the collision occurred where the meter sticks met to avoid any issues with balls traversing the junction of meter sticks. We were then able to have an incoming ball impact two stationary balls and demonstrated the characteristic behaviour at measurable speeds. The resulting collisions were catalogued as shown in Table 1. Note that the three balls are identified as the “incoming ball”, “impacted ball” (the middle ball), and the “travelling ball” that begins moving as a result of the collision.
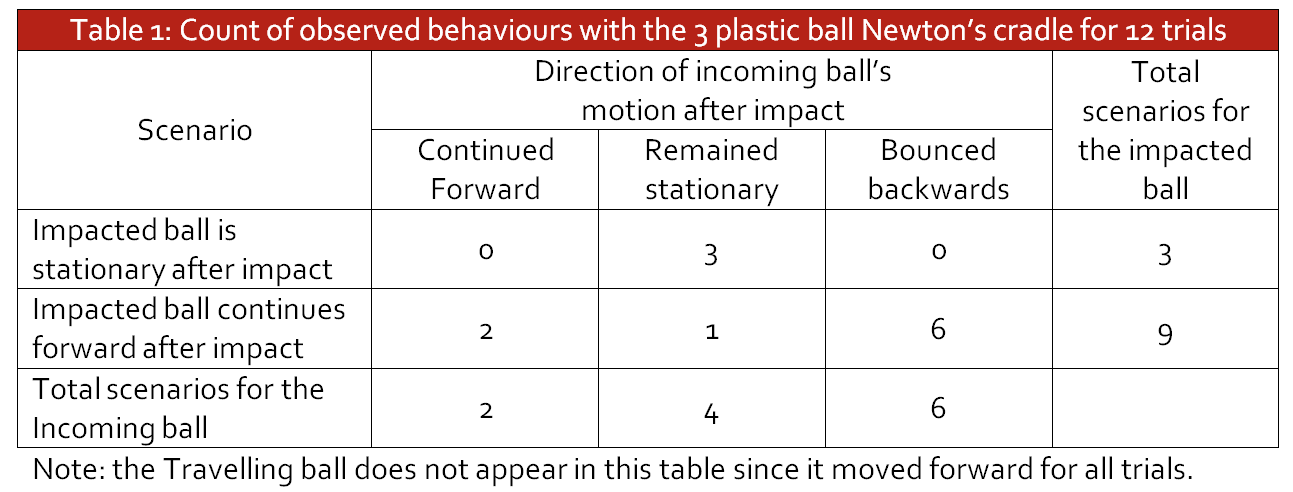
Table 1 was an important step in documenting the notion that there were characteristically different behaviours being observed. This contrasts the graphical result in Figure 2 (described below) that somewhat hides the categories because of diminished effect sizes. Note that there were changes in the language used to describe the experiments and there was a discussion around the teacher’s role in helping achieve consistent language by the students to describe the apparatus — much of this has been standardized here for clarity. However, it was evident that students need practice communicating results in order to achieve clarity in describing what has been achieved.
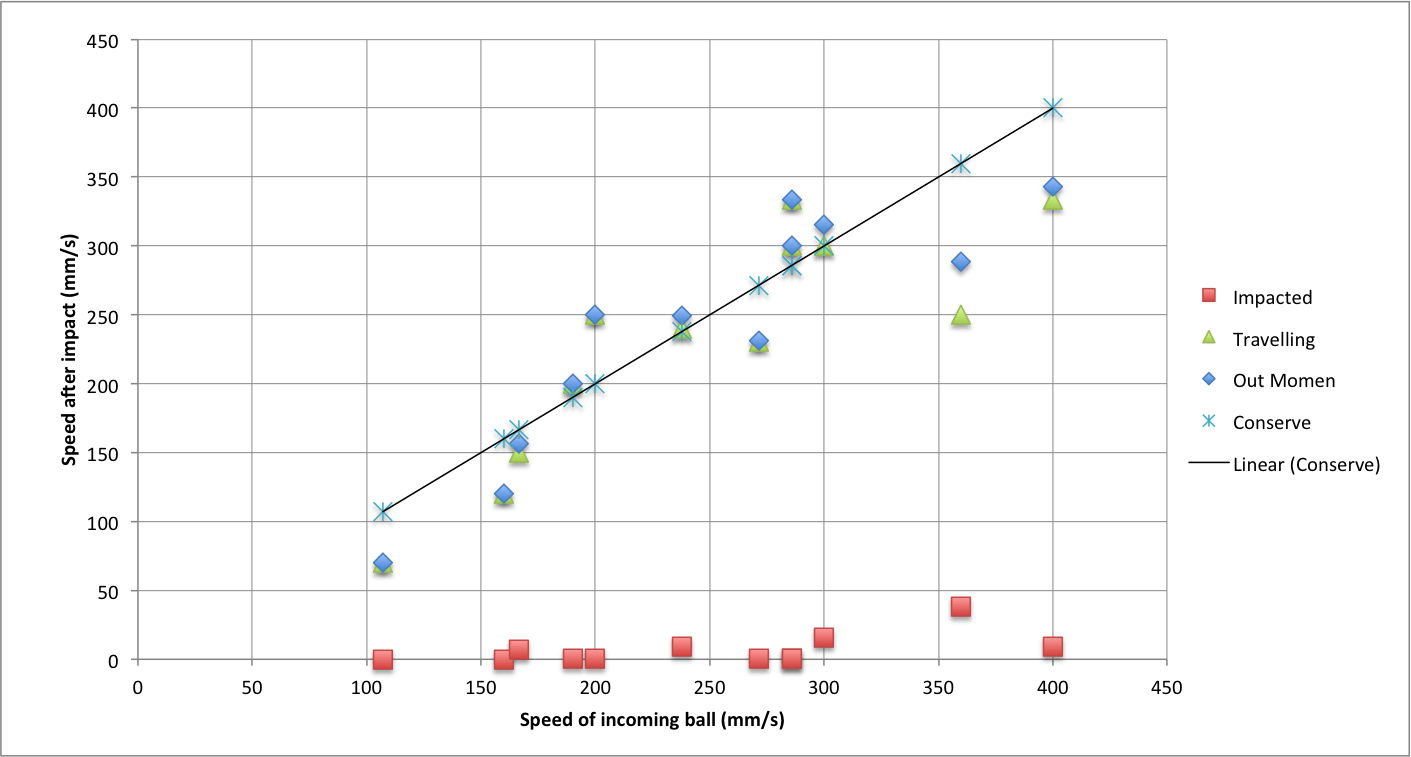 Figure 2: Experimental results using hard plastic balls.
The results in Figure 2 provided a context for talking about modeling of data. The graph shows the incoming speed on the independent axis and the outgoing speed on the dependent axis. The red squares show the impacted ball and the green triangles the travelling ball. The “out momentum” is the sum of the impacted velocity and the travelling ball, which, given all balls had the same mass, is proportional to the total measured momentum. “Conserve” has “x” marks that are on the fitted line. This line corresponds to the conservation of momentum that implies the sum of all velocities after impact are equal to the sum of the (single) incoming velocity.
The line of best fit is taught in Grade 9 mathematics, however, attention is not always given to the number of degrees of freedom that should be allowed when fitting a line. In the context of Figure 2, conservation of momentum implies that the fitted line must pass through the origin (i.e. direct variation) as opposed to having a non-zero
y-intercept. This is a very clear example of physics requiring a constraint that mathematics teaching often glosses over. Achieving the line of best fit in this circumstance can be determined using the origin and the coordinate with the average of the
x and
y measured momentum values (or given all masses were the same, the corresponding average total velocity values).
Handling experimental error arose from the graphing exercise. There is a natural inclination to draw on a myriad of factors to justify the “errors.” In fact, we showed that an outlier was due to a discrepancy in the way that measurements were extracted from a video. It was corrected, but also pointed to the constrained accuracy that was possible. In essence, the error was due to the geometry of reading a ruler on a desk based on the position of a sphere when the camera may not be directly overhead. We resolved the outlier issue after watching the video several times with discussions of how best to interpret the measurement. The result was consensus and the alteration of the data so that the outlier was no longer an outlier. The importance of justifying the alteration of the data was evident from the way it was handled.
The graph effectively showed that we were no closer to resolving why a hammer tapping Newton’s cradle gave rise to a different result than the release of a ball (or two). The simplicity of the scenario was not intended to reveal a definitive result. It was expected that by understanding the simple case we could determine a way forward, with confidence, to address the case with three stationary balls. However, trials with three stationary balls demonstrated the same effects as Newton’s cradle. An impact by a ball led to one ball travelling off the other end, while tapping with a hammer led to immediate separation of the balls. Pedagogically, the lesson in the simple experiment was about Occam’s razor; that we are seeking a simple solution in spite of the complications of errors and noise. The experiment, so far, illustrated that all discrepancies from the fitted line in Figure 1 were essentially irrelevant to the theoretical understanding we wanted.
To further investigate the phenomena it was decided that there was a need to remove the rotational motion of the spheres. As is well known among billiard players, minor variations in the way the cue impacts the ball can result in different outcomes. We could not rule out the possibility that the amount of surface friction during the impact of a rotating ball with a stationary ball could have a significant affect on the outcome. Since it was winter and ice rinks were readily available, it was decided that hockey pucks might be a method to alleviate the rotational question. It was also noted that we could determine the coefficient of friction for the hockey pucks and use the distance travelled before stopping to calculate velocities immediately after impacts.
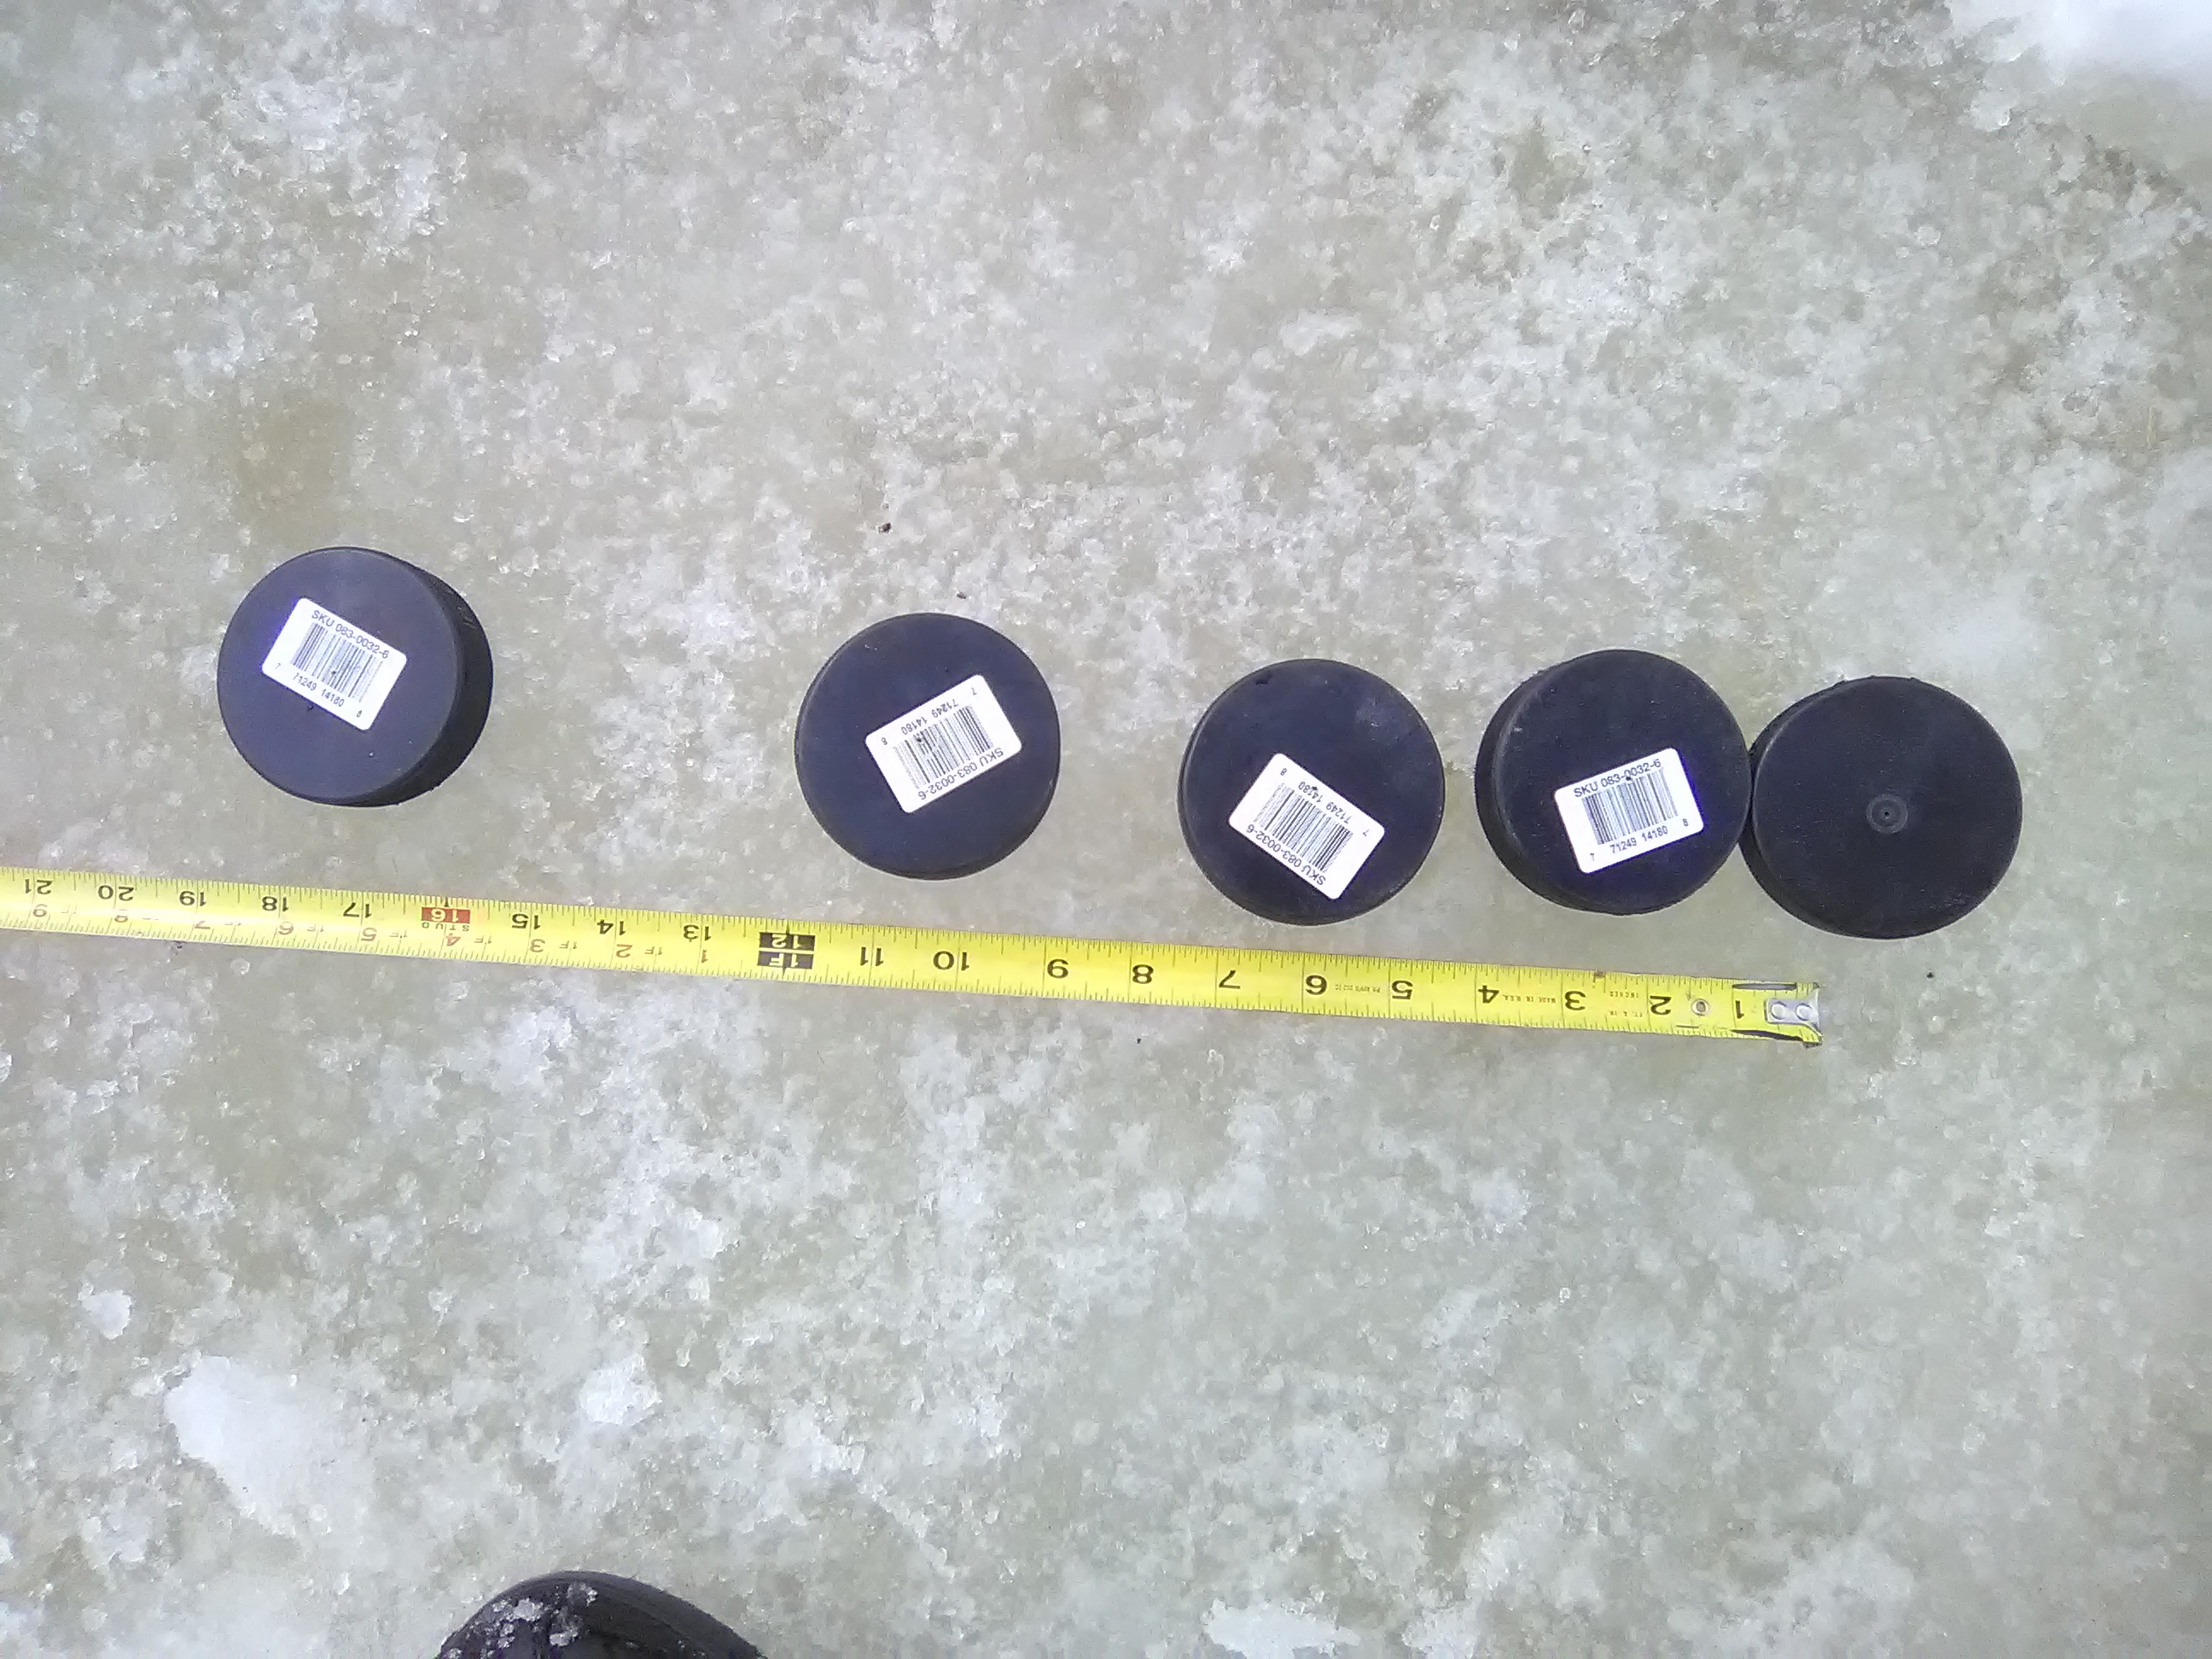 Figure 3: Hockey pucks moments after a collision
The experiment was thus repeated with hockey pucks. This had the added benefit that we could stack pucks to have the weight of two or three in the impact. Additionally, one puck was cut into pieces allowing 1½ pucks and other fractions of a puck including one piece that was essentially of random size. The experiment is shown in Figure 3 moments after a stack of two pucks came from the left and collided with three stationary pucks. The collision took place at the zero mark on the tape measure (the level was for aligning all pucks on a straight line). It shows clearly that all the pucks were moving after the collision.
As good as this scheme appeared, there were no observations consistent with the regular Newton’s cradle and the overall result implied that the rubber material of hockey pucks fundamentally changed the result. We were, of course, aware of the difference between elastic and inelastic collisions but anticipated the effect might not be too pronounced. Subsequent to this failed experiment, a Newton’s cradle was made using hockey pucks to demonstrate definitively that the pucks always separate. We take heart in the fact that Newton used clay balls for inelastic collisions and ivory for elastic collisions (Gavenda and Edgington, 1997). Perhaps the hockey puck is a good way to connect with what Newton thought was suitable experimentation.
At this point we considered the use of steel pipe cut into rings that could be slide on ice. As an experimental design this would resolve many issues and facilitate further study complete with a method for testing impacts with non-integer multiples of the ball weight. However, a Pasco pressure sensor made it feasible to pursue a different approach.
A hypothesis was created by careful consideration of the details of the experiments. Key among the considerations was the notion that there is a time delay between the impact of the initial ball and the departure of the travelling ball. This leads to the question of what happens to the energy and momentum during the time delay. The energy can be envisioned as converting from kinetic energy to potential energy. However, conservation of momentum suggested that compressions and rarefactions of the material could be hiding momentum in plain sight. It was therefore hypothesized that an impulse generated by an impact would travel at some proportion of the speed of sound in the material to the travelling ball and that once some level of momentum had arrived the travelling ball would depart. In a Newton’s cradle because the incoming ball(s) would be matched to the outgoing ball(s), the observations would be consistent with this model. In the case of a hammer, the impulse would be a different length and after the initial ball departure any remaining momentum would begin to cause the second ball to move.
The hypothesis was tested for reasonableness by taking two heavy washers that were a ¼ inch thick, one with a diameter of 2¼ inches and the other square with a side length of 1¾ inches. The washers were made of aluminum and steel respectively. When the washers tapped the Newton’s cradle on the side of the washer, so that ¼ inch of material was impacting, the standard Newton’s cradle behaviour was observed and one ball departed at the other end. When the same washers impacted longitudinally, so that 2¼ and 1¾ inches of material was impacting, some separation of the balls was observed and more than one ball departed the other end.
With this hypothesis qualitatively validated, an experiment was designed to use a Pasco pressure sensor. Specifically, we took bolts of different sizes (see Figure 4, four bolts are on the left) with a nut and slid them down a loose cylinder onto the pressure sensor. This allowed us to examine the duration of the impulse measured by the sensor at 1 kHz sampling. The bolts were all marked the same way as SAE Grade 5 or ASTM A449 and were all made of medium carbon steel that had been quenched and tempered.
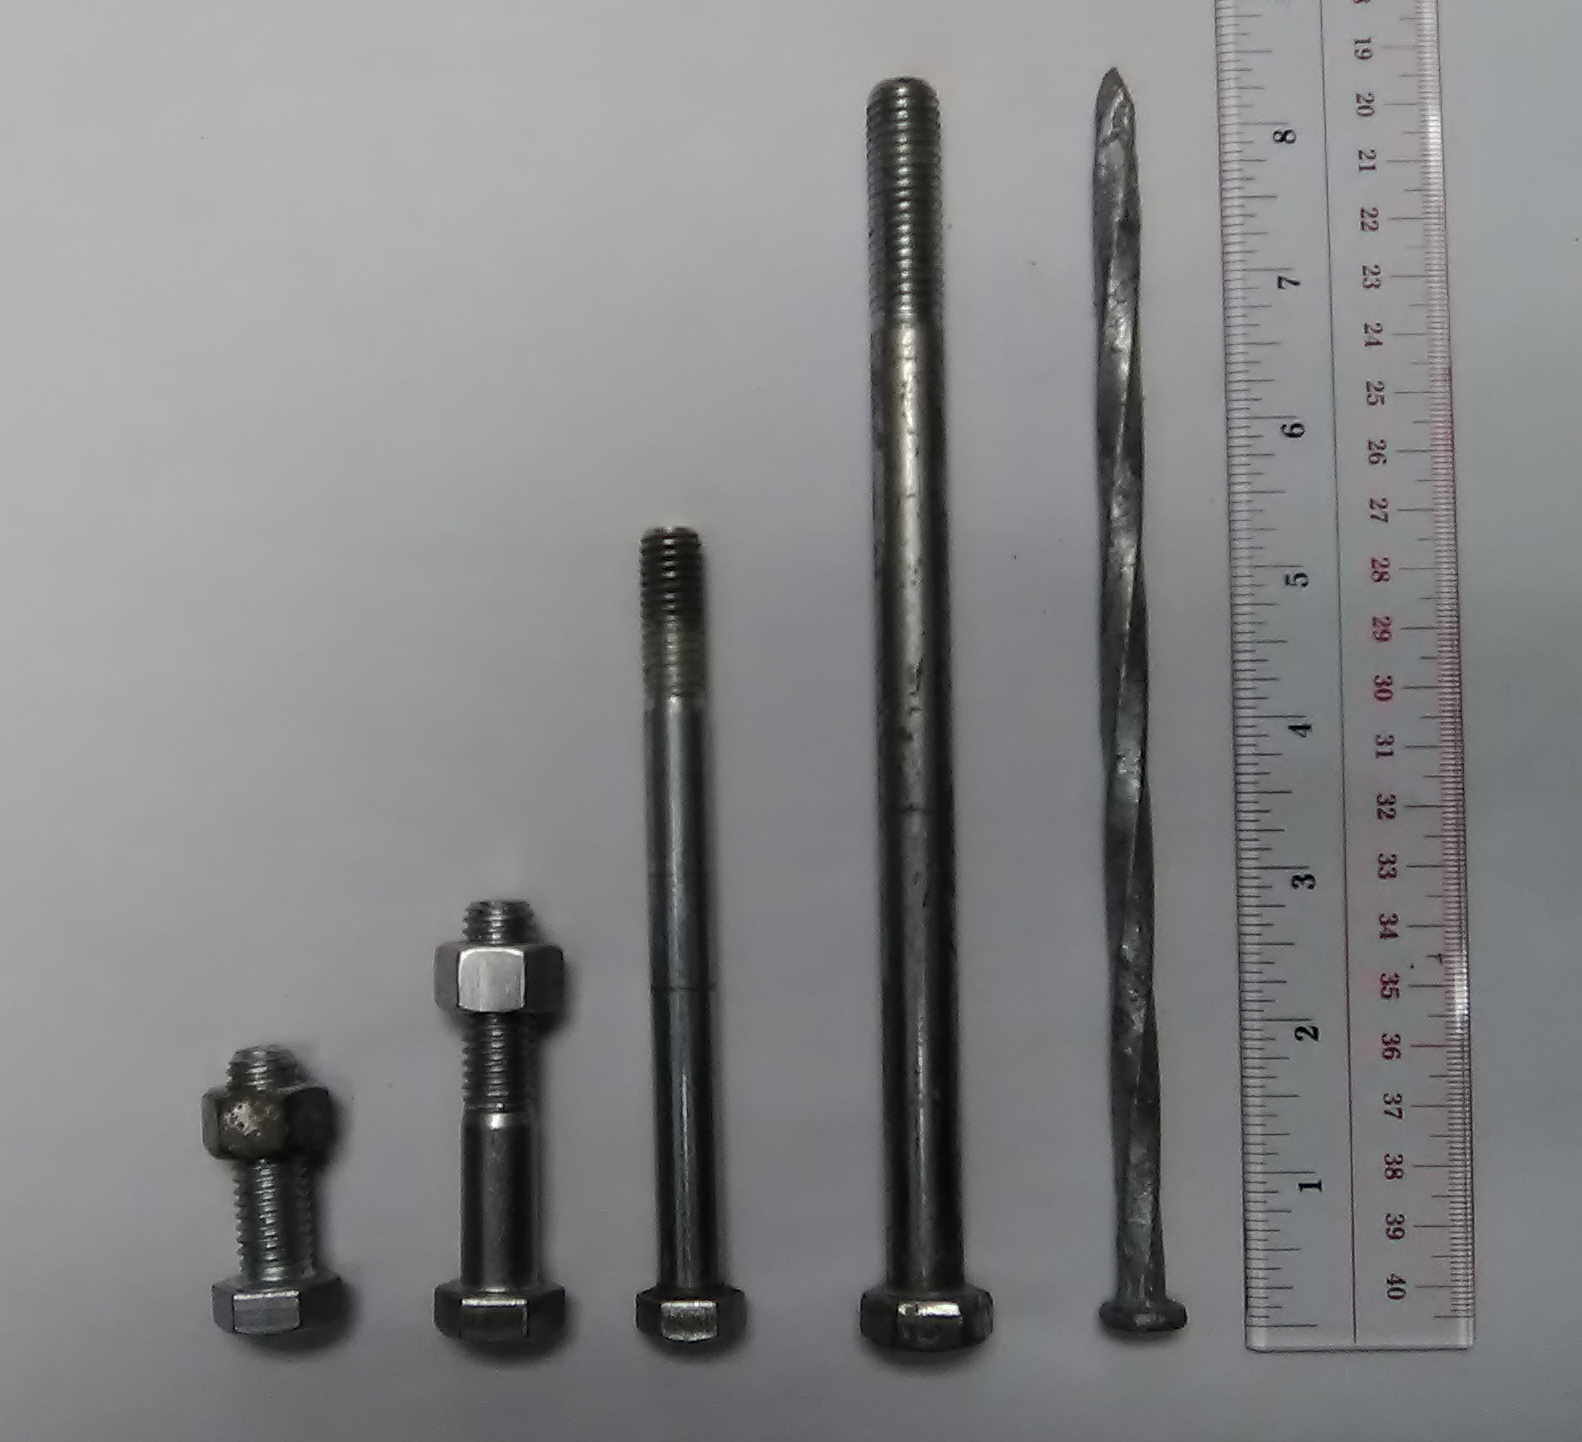 Figure 4: Bolts and a spike used to generate impulses
Each bolt was dropped on the sensor six times. The duration of the pulse was measured by counting the milliseconds taken for the pressure to increase. We noted experimentally that the height of the drop did not alter the duration of the pulse as expected. The results of the trials are shown in Table 2.
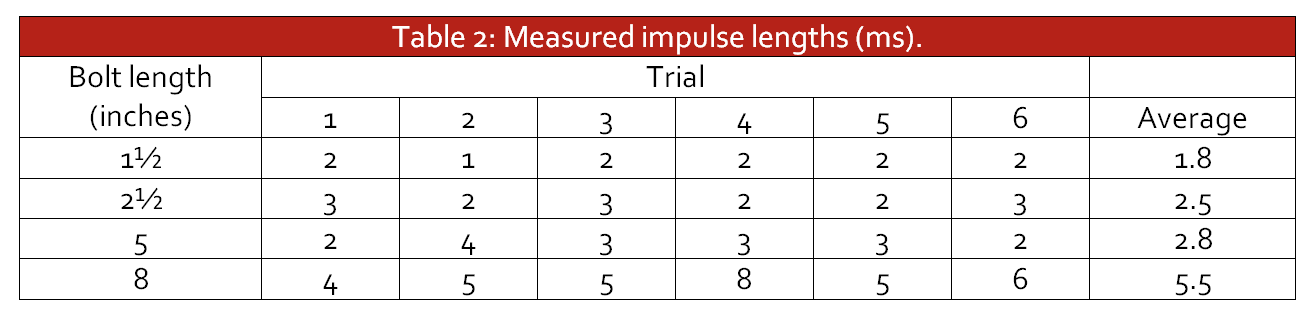 Table 2: Measured impulse lengths (ms)
The results show impulse length increases with the bolt length. It is not directly proportional but the variation in length is clearly having an effect. In addition the data was noisy on both ends of the pulse transition and the counts themselves will have minor error due to this.
Two additional tests were conducted. The first test was measuring the pulse length of the aluminum spike shown at the right of Figure 4. The length of the spike was 8 inches and it led to a consistent 3 ms pulse length. What is informative about this case is that the ratio of the pulse length of steel to aluminum is 5.5/3 = 1.83, which is nothing like the ratio of the speeds of sound 5900/6300 = 0.94. This is indicative that the pulse speed is not dictated by the speed of sound in the material.
The second additional test was to use a bolt that is short but quite heavy (not shown). It is 4¾ inches long and the diameter on the threads is an inch. It is made of the same material as the other bolts (medium carbon steel). Trials with this bolt were between 10 and 15 ms with a difficulty arising in determining the exact impulse duration because the top of the pulse was not entirely clear due to the presence of multiple peaks. This appeared to be due to a bounce effect. What was evident was that, in spite of being made of the same material, the pulse length was substantially longer than the five-inch bolt in Table 2. The implication is that the geometry of the bolt affects the speed at which the impulse is transferred out of the bolt.
The interpretation as this effort drew to a close was that impulses are impacted by the geometry of the items colliding. In the same way that echoes and reverberations may delay the arrival of a pulse of sound. This suggests that a pulse may well be comprised of rarefactions and compressions but that they take an irregular route through the collisions. In addition, the findings were indicative of the material playing a role. This was known in advance, as elastic and inelastic collisions are different. This had been validated with the hockey pucks and when the pucks were dropped and the pulse lengths measured for them had an average of 10.4 ms. However, steel and aluminum being different is indicative that there are differences between different metals.
We concluded that the scientific method is more subtle than it was thought to be. Considerable care was needed to design the experiments to determine what is occurring in Newton’s cradle. The two purposes pursued here, better understanding of the scientific method and experimental design for investigating Newton’s cradle, warrant giving it closer attention. The realization that it is helping make a connection to the moduli of elasticity of the material and how that is distinct from the speed of sound served to clarify details that are often ignored because of an emphasis on gases. The “discovery” that there is also a geometric component to the transmission of energy and momentum through the cradle (or a series of hockey pucks) opens the door to other possible investigations. One might, for example, ask if mechanical waves are refracted at the boundary between two different solids. This is very likely a question that can be verified in a high school classroom.
Our final thought was that Newton’s cradle is a very crafty design that hides many details that must have gone into its design. Far from being a toy, it is an application of material science that highlights opportunities for the physics classroom.
References
- Gauld, C. F. (2006). Newton’s cradle in physics education. Science & Education, 15, 597–617.
- Gavenda, J. D., & Edgington, J. R. (1997). Newton’s cradle and scientific explanation. The Physics Teacher, 35, 411–417.
- Hutzler, S., Delaney, G., Weaire, D., & MacLeod, F. (2004). Rocking Newton’s cradle. American Journal of Physics, 72, 1508–1516.
- Lovett, D. R., Moulding, K. M., & Anketell-Jones, S. (1988). Collisions between elastic bodies: Newton’s cradle. European Journal of Physics, 9, 323–328.
(Shows times of subsequent collisions are half the previous collision time.)
Tags: Energy, Motion