Dale Simnett, Peel District School Board
dale.simnett@peelsb.com
Part 1: The Case for the Humble Video Analysis
Friends, Peers, Physics Teachers,
The use of video in physics as a means of teaching and learning is as old as optic obscura. I’m sure most physics teachers have a video analysis project that they can dust off and give to their students. Identifying the terrible physics in cartoons, superhero movies, or more recently, the Fast and Furious series, is a right of passage in physics teaching!
Observing the world, making measurements, and trying to make sense of what we see is at the heart of physics. Why not make that a goal in our teaching as well as our assessment? I propose using a video analysis as an end of unit assessment.
Why should you try video analysis as an assessment? Here is my case.
They are easily produced. Two classes writing at different times or different days? A student requiring writing at an alternative time? Students asking for test practice questions? An assessment can be produced with a 15-minute trip to YouTube. Take the following Grade 12 two-dimensional forces assessment — this is the entirety of the instructions for the assessment.
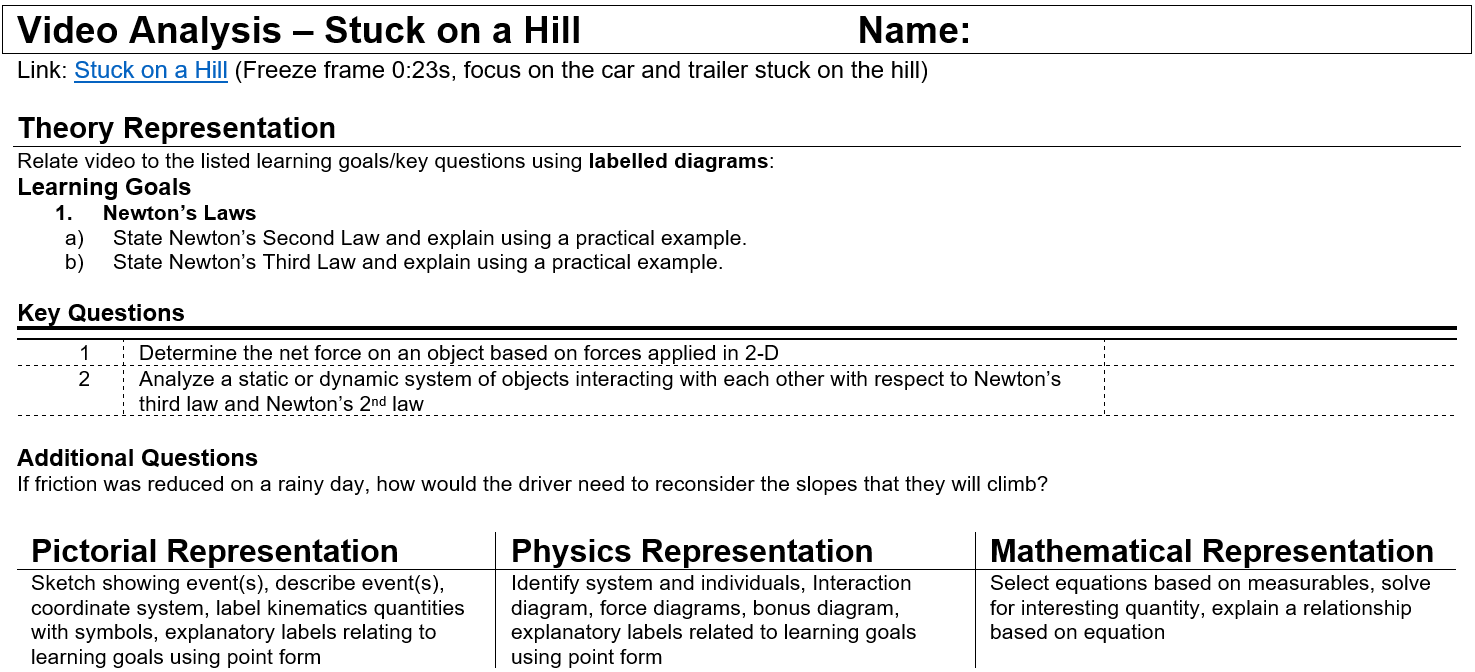
To create a new assessment requires finding another video on YouTube involving two-dimensional forces — snow boarding, roller coasters, anything with a ramp, YouTube can provide rich examples of two-dimensional forces in a heartbeat. Just include the link and add an additional question that points students towards an interesting aspect of theory, and you’re finished. The ease of creating an entirely new assessment means you can distribute them freely and students can practice to their heart’s content.
No more long-winded descriptions. The best part of a video analysis is students are doing authentic physics where they start from observation and analyze real life. To help students understand a written question, I have incorporated strategies such as collaborative group discussion of a problem, pretty diagrams, and flailing my hands at the front of the classroom on numerable occasions. English language learners, amongst others, can still struggle to wade through the numbers and words used to describe a real-life situation. A video allows the student to develop their own description. There are students who perform significantly better on their video analysis than on their standard problem-based assessments, I ask them why and consistently I hear “I know what is going on.”
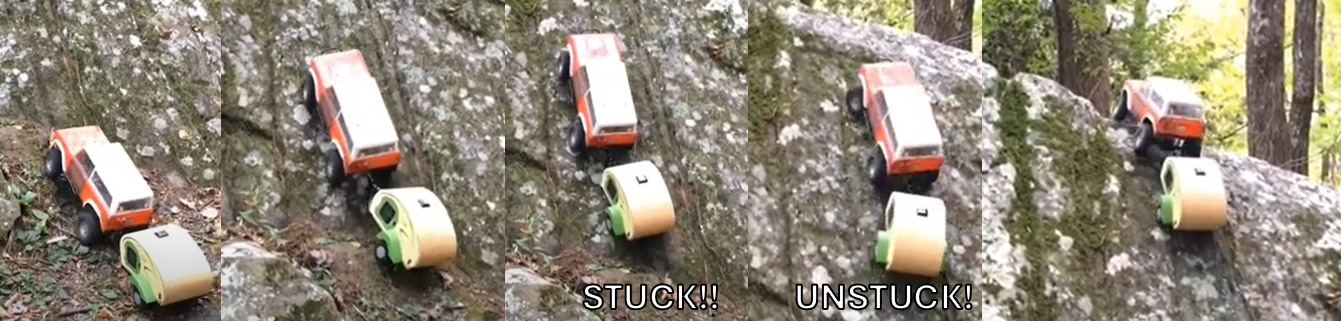 Stuck on a Hill video
 During assessments, I’ll play the video on repeat at the start of class for several minutes and let them have 5 minutes with a whiteboard to discuss what they saw. Then the whiteboards are whisked away, and the assessment is handed out along with a rubric and good old fashion lined paper. Students can ask for the video to be replayed for further clarification.
Freedom from given values! But where are the numbers? Students will look for values to plug into equations and they won’t find them. This may cause some consternation.
We know that measurement informs physics. For the situation, students are encouraged to think about what you could easily measure to use as a “given”. We don’t need a value, but we accept that a value could be attained if we had a measuring tape, timer, radar gun or scale. Due to the potential for this value to vary, we will call these terms changeables. The challenge is to create an equation with only changeables that represents the situation mathematically.
There are two added super bonuses.
First, being free from numbers allows students to start thinking about what the equation represents and how the changeables are related to each other. We can talk about proportionalities, what if’s (what if this was heavier or the displacement required was greater) and further develop the ability to describe how the mathematical relationship represents real life.
Second, would you like to teach students programming? The ability to prepare an awesome spreadsheet by learning to “program” a formula into a cell may be the greatest gift you can give for their future success (until A.I. ups its spreadsheet game). The day after the assessment, “program” the formula into Excel, iterate the equation by changing one changeable and plot the effect on another to visualize relationships. This can take an assessment and turn it into a learning opportunity to develop a deeper understanding of the relationship between changeables.
(Note: Changeables was a poor attempt at mathematics humour. Variables would, of course, be the common parlance.)
Have I convinced you to give it a try? Next, let’s look at the success criteria for a video analysis.
Part 2: The Success Criteria for a Video Analysis
Draw diagrams to represent the situation.
Students are expected to create visual representations that accurately represent the situation. They start with a kinematics diagram to describe what they see and then layer on different diagrams to analyze forces, energy, and more.
They are expected to use explanatory labels on these diagrams to explain the learning goals. In this case the learning goals involve Newton’s 2
nd and 3
rd laws. An additional “bonus” diagram is required to help explain a learning goal or a relationship between variables.
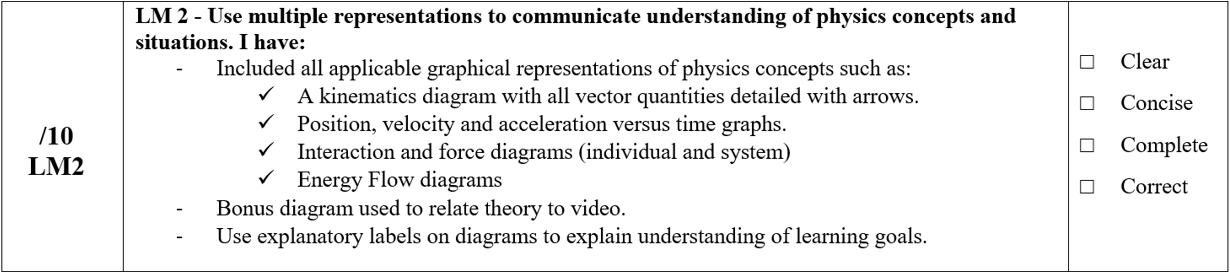 Rubric for using diagrams to analyze the video
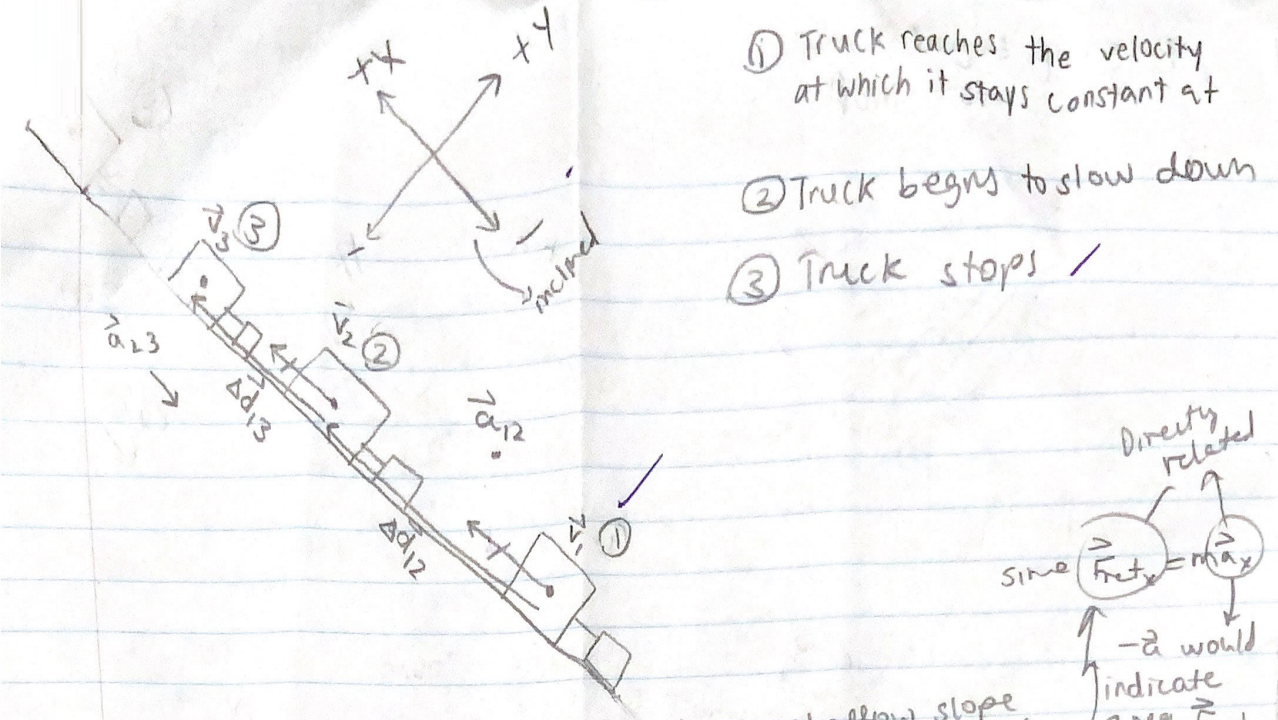 Kinematics diagram for the truck getting stuck — Student Work
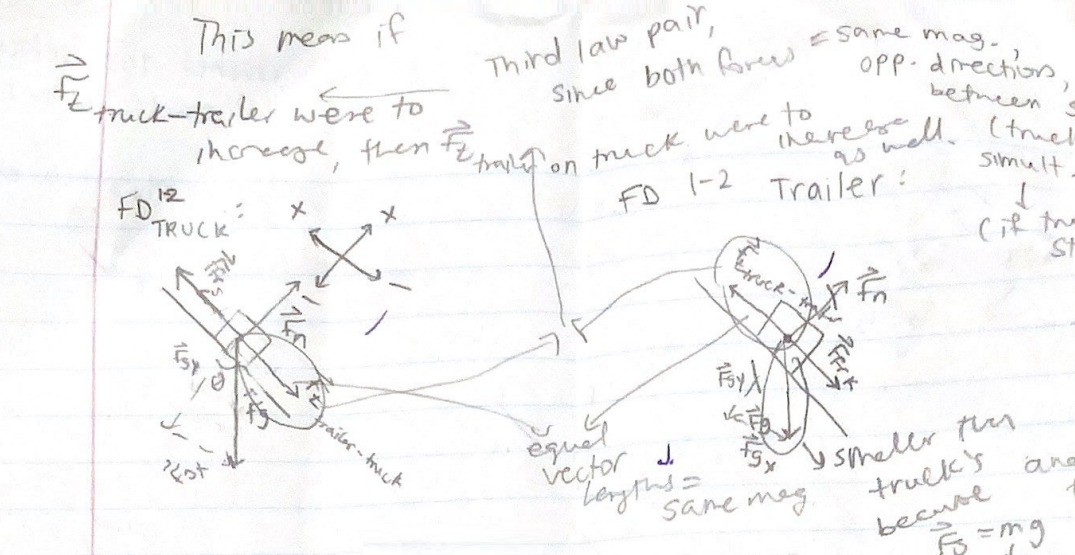 Using explanatory labels on force diagrams to explain Third Law — Student Work
Create a Mathematical Representation
During the term, students spend time looking at solved problems and breaking down the mathematical steps to analyze a situation. Collaboratively, they develop a problem-solving strategy that outlines a step-by-step approach to analyzing a situation. Their mark is based on how well they can apply that problem-solving strategy to the question.
An additional requirement is that once they develop their equation, they pick one line of their analysis and describe how it relates to the learning goals listed or the additional question.
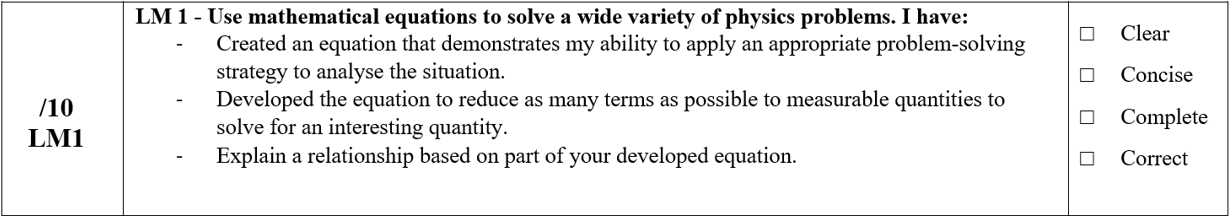 Rubric for using equations to analyze the video
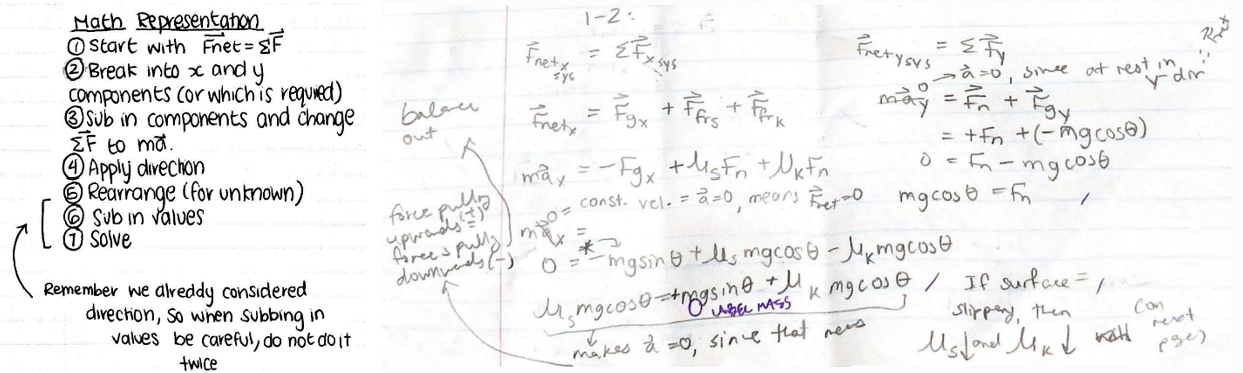 Strategy and Mathematical Analysis — Note: The final line was used to explain Second Law
Explain the Learning Goals Using the Video
Meeting expectations involves using both diagrams and equations to relate the learning goals to the video and answer an additional question. If done well, an assessment won’t feature paragraphs of text or word-for-word descriptions of theory, but instead would use explanatory labels on their mathematical analysis and diagrams to describe how the learning goals relate to the situation. The learning goals below have been (partially) explained by labels in sections 1 and 2 above.
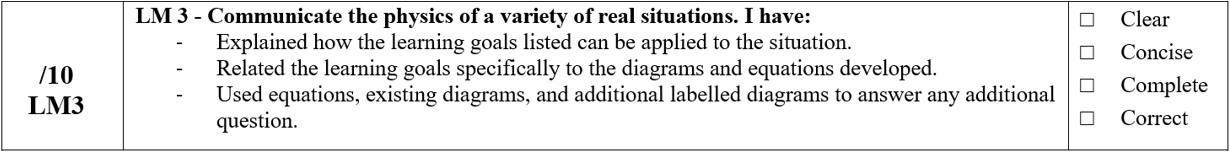 Rubric for relating video to theory
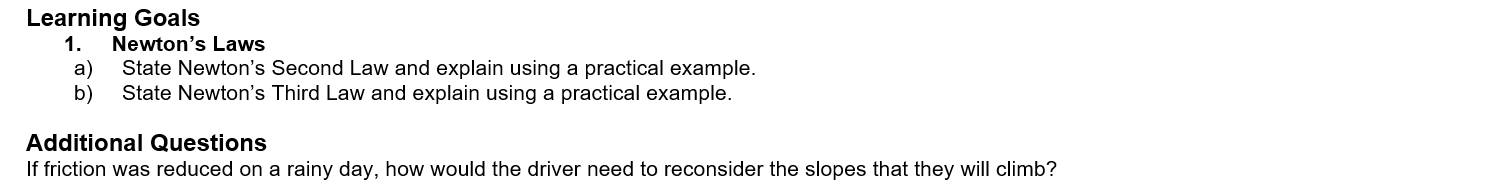 Learning Goals and Additional Question to Explain using Diagrams and Equations
Part 3: The Wrap-Up
In my classroom, I will do both traditional problem-based assessment and video analysis assessment. They complement each other nicely and have students develop a separate set of skills. Even in my problem-based assessments, I try to incorporate a video that represents a similar situation to provide a visual representation. My final exam consists of a problem-based assessment for the first hour and a video analysis for the second hour. Some students prefer one type of assessment while others prefer the other type. Either way, they are having fun doing physics!
For a collection of video analysis assessments and other problem-based learning resources,
follow this link to my google drive. If you have any questions, feel free to contact me at
dale.simnett@peelsb.com.
Tags: Assessment