Chris Meyer, President, Ontario Association of Physics Teachers
Christopher.meyer@tdsb.on.ca
Static electricity might very well be the most important topic taught in high school science. Exploring static electricity teaches us how charged particles behave, which becomes the basis for understanding the structure of the atom, chemical reactions, the behaviour of complex biological molecules, cells, and even human thought. Static electricity is challenging to understand because it is invisible; we can’t see the particles doing their thing. As a result, we need to help students construct concrete, visual models of charged particles and provide students with visual ways of verifying their understanding of static electricity.
Small Bits MoveTake two layers of transparent tape (“invisible” tape), stick them together (sticky side to smooth side) and pull them apart. Voila, you get a strong static electric interaction between the two separate pieces. On a microscopic level, small bits of matter have moved from one surface to the other (notice how the patches in the illustrations match up nicely with the opposite side).
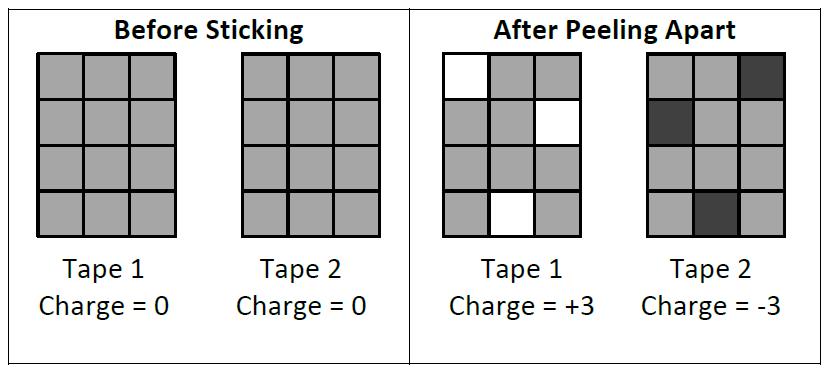
Careful experiments show that the moved bits can be individual electrons, halves of ripped apart molecules, or whole chunks of material, depending on the particular materials involved. For simplicity in grade 9 (and the rest of high school), we will assume only single electrons move. In either case, what started as neutral matter is separated into positive and negative pieces. In our first visualization we show this as black, white and grey coloured squares (white + black = grey). It is also helpful to quantify the visualization by giving the net charge.
An Analogy with Integers
We describe charge using an analogy with integer numbers, which introduces an important conceptual hurdle. In our tender youth, we were all happy with whole numbers, which make intuitive sense to us: if you have three things and take away one, you are left with two things; if you take away the remaining two, you are left with nothing and you certainly can’t take away anything more. Integers break this cherished rule: you can take something away from zero. Our students don’t like this! We use the terminology of “positive” and “negative” charges because net charge behaves like integer numbers. However, there are limits to this analogy: integers provide no insight into what is physically happening. Zero net charge does not mean there is nothing there! To help overcome this conceptual hurdle, we need to use a visual tool to help give structure to the idea of zero net charge.
The Charge Pair and Charge Diagrams
If we take a simplistic approach to the integer analogy for net charge, we get the set of diagrams below: regions of positive and negative net charge are shown and neutral regions are ignored, as if they don’t exist.
This deprives students of a physical model of neutral matter that they can use to reason about the behaviour of charged particles. Our remedy is the introduction of the idea of a charge pair: a pair of positive and negative particles that combine to produce one unit of neutral matter.
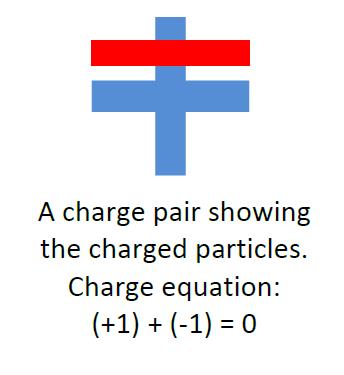
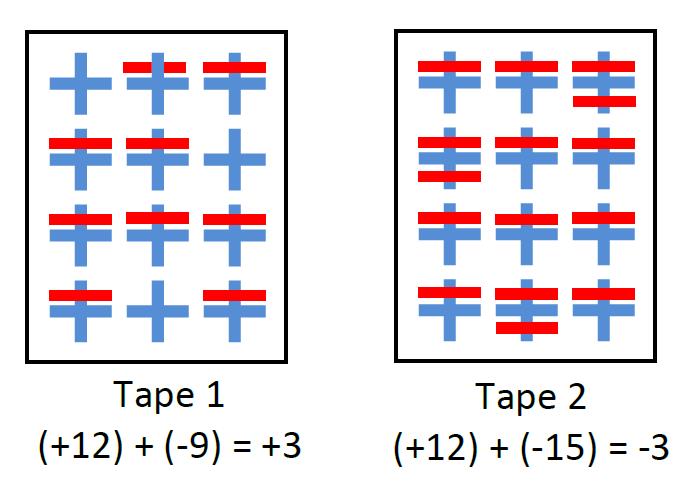
The negative particle is a single electron (an outer or valence electron) and the positive particle is the positive ionic core: everything else in the atom, minus one electron. From our study of chemistry, we know that the electron and positive ionic core physically overlap (the electron’s orbital is spread in space around the nucleus). We visually represent this by drawing a plus and minus that overlap using different colours. Good reasoning about net charge is represented by writing a charge equation that shows how the positive and negative charges add to yield the net charge. Returning to our pieces of tape, we can construct a charge diagram that shows the distribution of charged particles in each piece.
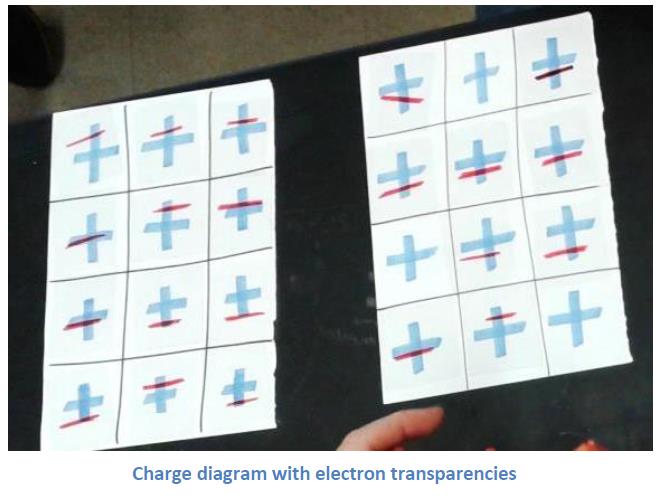
I have also made a paper version of this with the positive ionic cores drawn in place on the sheet of paper and the electrons drawn on pieces of overhead transparencies. This makes it easy to move around those electrons and show the changes. It also makes clear the results of the electron’s movement, leaving a positive ion behind and forming a negative ion at its destination.
 A Physical Model of Charge in Solid Matter
Let’s be picky for a moment. The physical model we are developing here is best suited for describing charges in ionic solids and metals where it is just single electrons that move about. If we are working with covalent solids and polymers, things are more complex: large fragments of molecules, some of which might be positive, can move. These are details our grade 9 students don’t need to be aware of, but it is helpful for us teachers.
Back to our regularly scheduled program. An important concept that the charge diagrams help reinforce is the mobility of the electrons and the fixed nature of the positively charged ionic cores. This idea, that the positives are fixed and the negatives move, is critical for understanding atomic structure with the positive particles locked in the nucleus of the atom and the behaviour of electrons in metals. This prepares students conceptually to study chemistry and current electricity. I am very fond of the ball and spring model of solid matter, which I use to represent many different concepts.
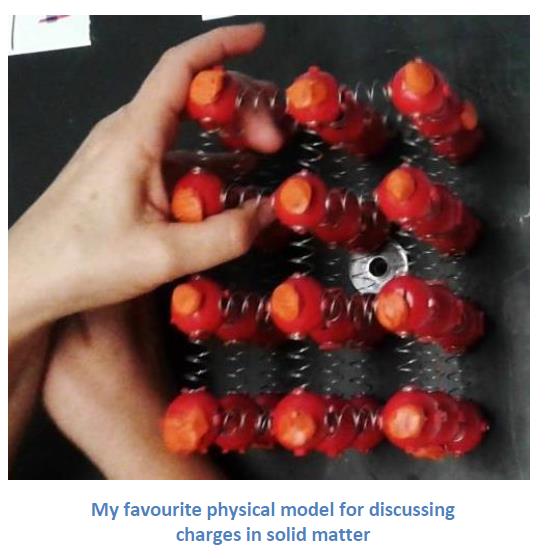
The model helps illustrate why the positive ionic cores are fixed in place – due to the springs that represent bonds between each atom or molecule. I add blobs of plasticine to each red sphere to represent the electrons that are able to move.
Subtle Movements – Polarization
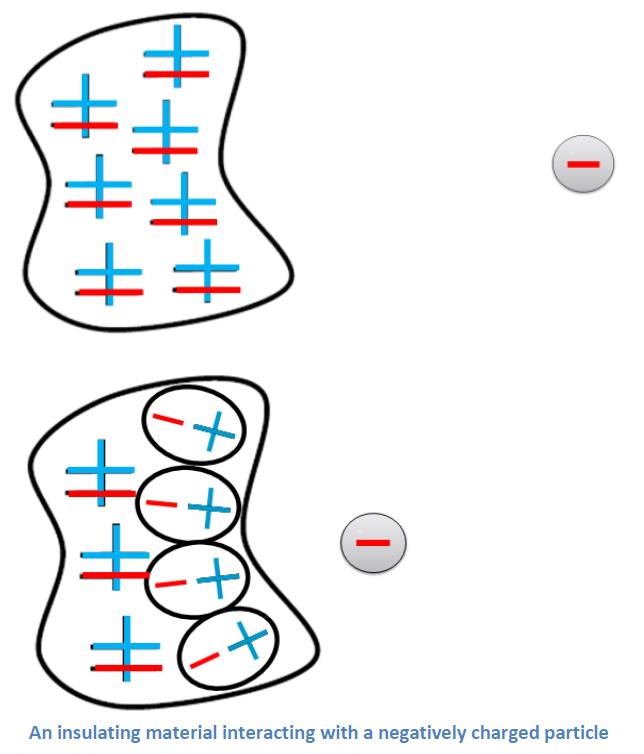
Why does a neutral object interact electrostatically with a charged object? These situations are so commonplace that an understanding of everyday static electricity is incomplete without it. Our charge diagrams are a great tool for shining light on this phenomenon. Neutral matter is made of equal amounts of positive and negative particles. These individual particles are attracted or repelled by charged objects nearby. We can show this carefully by showing a shift in the positions of the electrons. Insulating materials have a tight hold on their electrons and don’t allow them to move very far. We represent this idea by drawing the electron shifted over inside an oval that includes the positive ionic core. Shifting electrons in neutral material causes it to become polarized. The polarizing effect is strongest in the neutral particles nearest the charged object. This is shown in a very simplified way with one column of particles polarized and the further column unaffected. Careful measurements show that polarized electrons in insulators shift only a tiny fraction of an atomic radius; our diagram is very exaggerated.
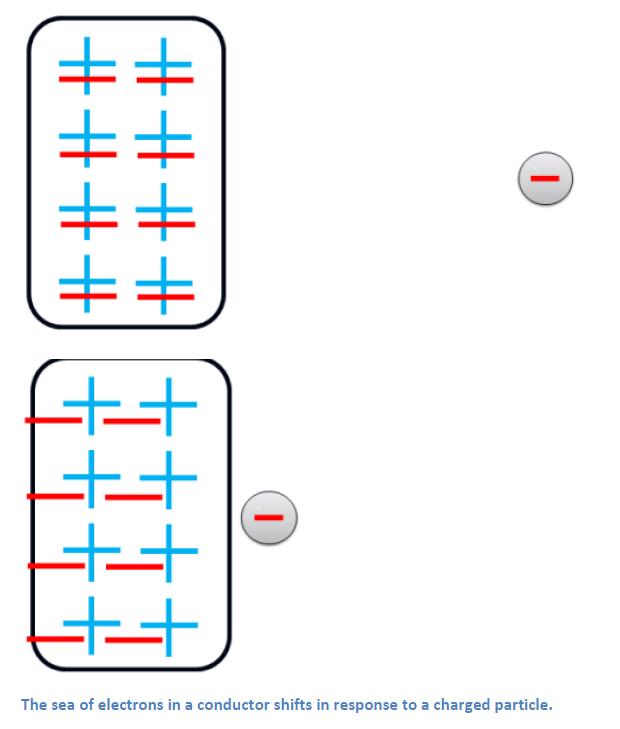
Neutral conductors polarize in a related way, but with two important differences: the conduction electrons (the outer electrons we have been visualizing) are not attached to any particular ionic core; and the conduction electrons move as a group – we call this the “sea of electrons”. The end result is often a stronger polarizing effect and stronger electrostatic interaction with conductors than with insulators.
 Interpreting Visual Representations
When students have reliable, visual representations, they are much more successful in their reasoning. Humans are visual thinkers: pictures express many complex ideas in simple ways and our memory systems favour visual information. However, students must also be taught to make sense of visual representations; this process is called interpretation. At each step along the way, students must practice interpreting diagrams by describing the ideas they represent. In our teaching, consistently using the word “interpret” helps cue the appropriate thinking processes. Taken together, interpretation and visualization provide a quick route to building deep conceptual understanding. Students will become more confident with their understanding and less will be left to guesswork or memorization.
In my next article, I will describe visual ways to help build and verify students’ understanding: and by that I mean lots of static electric experiments!
Learn More!
If you want to geek-out on static electricity, check out this article which is a great summary:
- Lacks, Daniel J., and R. Mohan Sankaran. "Contact electrification of insulating materials." Journal of Physics D: Applied Physics 44.45 (2011): 453001.
If you are interested in the teaching materials we use for grade 9 electricity, please visit:
http://meyercreations.com/physics/resources.htmlTags: Electricity