Chris Meyer, Past President, Ontario Association of Physics Teachers
christopher.meyer@tdsb.on.ca
The stock and trade of the science teacher is the Bohr diagram. Ask a random person off the street what an atom looks like and they will describe a Bohr diagram (well, actually something similar but with ovals — just Google “atom”). But is the Bohr diagram a useful representation of the atom to teach students? In this article we will explore the conceptual foundations of the Bohr diagram and my proposed alternatives. Along the way, we will delve into the science of the atom and flesh out some challenging ideas. Now, normally when I write an article, I share well-rehearsed practices from my classroom. This article will be different! Here I share my musings as an attempt to define this problem and layout possible solutions. I'll also let you in on a little secret of mine: when I want to learn more about something, I choose to write an article about it! Since this is an exploration, I would be very happy to hear your thoughts on these ideas. I am no chemist and I recognize that I am venturing into dangerous terrain. Read on!
Representations of science concepts
Lots of real things in science are invisible to our eyes due to their ephemeral nature or their scale. To help understand these things and activate our powerful visual thinking capabilities, we draw cartoon-like pictures called “representations” that depict conceptual models: abstractions and simplifications of the real thing, complete with explicit assumptions and limitations. Whether a representation is useful depends on a few things:
- Scientific Power: Can it help us reliably predict or explain a useful range of phenomena?
- Efficiency: Does it help us think about complex ideas in a quick and clear way?
- Sense-making: Can it help us interpret and make sense of abstract ideas, especially mathematical ones?
- Model expert thinking: Do people who work in scientific or technical fields (not including education) actually think in these ways?
- Correctness: Does it introduce ideas that need to be later unlearned? Or do its ideas usefully build toward deeper or more powerful models?
The representations I use in grade 9 science such as charge diagrams, circuit diagrams, particle diagrams, and cycles of matter sketches, usually satisfy the first four of these criteria while not running too far afoul of the fifth. So, what about the Bohr diagram?
The Bohr model of the atom
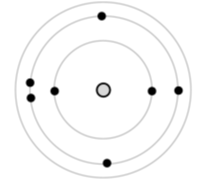
Many scientists contributed to what I am calling the Bohr model of the atom. Normally, I like to change the names of things to ones that are self-explanatory for students — the “orbit model” of the atom, for example — but I don’t want to throw off too many of my readers! The Bohr model was a triumph of scientific reasoning. For the first time, people could accurately predict the energy levels of the hydrogen atom using the ideas of electrical interactions, orbits, and a simple quantization of energy (or angular momentum). As a result, we draw pictures resembling a planetary system with orbits only at specific distances from the nucleus. Here is a Bohr diagram drawn according to my current instructions for grade 9 students. Can you name this element?
A favorite game of scientists is taking a model and seeing how far they can run with it. They love this game; just dare them and watch them go! So, people picked up this model, ran for the helium atom, and didn't make it! The Bohr model fails to predict the energy levels, or emission spectra, of the helium atom. It turns out that other ideas were needed to explain what happens when more than one electron is present in an atom. So how far should we try to run with the Bohr diagram as a scientific and educational tool? Do we dare use it for atoms with more than one electron?!
The strengths and weaknesses of the Bohr diagram
Let’s figure out what the Bohr model does well and what it doesn’t. Occasionally, I offer a deeper dive into the science of the atom to tackle ideas that are often hinted at in our classrooms but are seldom explored carefully. So, if you want to nerd things up, read the “deeper dive” sections and follow the links. If you want a quick overview, you can skip the grey text.
Vocabulary refresher: let’s talk atoms!
- Atom: a stable arrangement of electrons around one nucleus
- Orbit: the path a planet takes around the Sun, a very basic approximation to the movement of an electron around the nucleus
- Orbital: the region of space an electron is likely to be found in, based on its energy and angular momentum
- Orbital Angular Momentum: the amount of “turning motion” the electron has due to its movement around the nucleus
- Shell: the set of orbitals with similar energy values (identical values in the hydrogen atom, similar but not identical in other atoms, at least until the third shell)
- Subshell: a set of similar orbitals that make up a shell
- Spin: a sneaky form of angular momentum carried by each electron in quantized units, regardless of its movement around the nucleus
- State: a stable configuration for an electron (a standing wave) in an atom with a particular set of characteristics: e.g., energy, orbital angular momentum, or spin value
Strength: the orbit concept. The idea of electrons moving in patterns roughly around the nucleus of the atom is a very productive one that can’t be discarded at any level of study. The quantum mechanical picture of electron probability distributions doesn’t fully replace the orbit concept. Instead, it improves our understanding of the electron’s position, albeit in a very surprising way: using patterns of probabilities [hyperlink https://chem.libretexts.org/@go/page/49286 to the previous word “probabilities”] that are standing waves! So the idea of the electron moving around the nucleus is absolutely necessary to explain the magnetic properties of the atom - it just becomes an unusual and fuzzy picture due to quantum mechanical probabilities.
Deeper dive: orbital motion. The quantum theory of the atom according to Schrodinger or Dirac indeed predicts a movement of charge (a current density) with a circular symmetry roughly around the nucleus (around its z-axis), which accurately explains the magnetic field that moving atomic electrons generate (Ogilvie 2017, p. 12). In fact, in very massive atoms, the electrons are moving around the nucleus at a large fraction of the speed of light, causing those elements to demonstrate unique properties.
Deeper dive: the “path” of electrons. In these discussions, I am trying to be careful not to describe exactly what the electron is doing when it is going “around” the nucleus. Quantum mechanics doesn’t let us answer that question in a way most of us would like. Quantum mechanics can answer questions like, “what is the position of the electron at this moment?”, but it will give a probabilistic answer: “most likely in this region, less likely in that”. If we ask a question like, “an electron starts here and ends up there; what path does it take in between?”, we also get a probabilistic answer! The electron can take a variety of different paths and, if you are familiar with the double slit experiment, you know that it must take all of the possible paths at the same time — kind of like a wave! This is a very strange but well-verified result of quantum mechanics. This is the reason that orbitals are often represented using clouds with no clear path.
Deeper dive: preventing the collapse of the atom. A historic criticism of the Bohr model is that electrons moving in a circle are accelerating, so they should lose energy by emitting photons and fall towards the nucleus — the atom collapses! Quantum mechanics explains what prevents this: there must be an available (i.e., empty) lower energy state for the electron to fall into. However, orbital energies are quantized, so there is always a limited number of lower energy states available. In particular, there is no state with a lower energy than the 1s orbital of the atom, so no transition is possible and therefore no collapse of the atom! There is no classical analog for this lack-of-lower-state effect: it is as if a mysterious force (sometimes called the exchange force) prevents an electron from moving to a lower energy state. (Fun fact: there is a very small probability that the electron in a 1s orbital will be found inside the nucleus and a radioactive decay process can take place! This is a different idea than what we are discussing.)
Deeper dive: standing wave patterns in an atom. Similar to the standing wave patterns that form in a string, standing waves can form circular or spherical patterns around the nucleus of an atom. These patterns are called spherical harmonics and are identical to the atomic orbitals that we might be familiar with (s, p, d, etc.).
Strength: shell filling and reactivity. Bohr diagrams can represent the periodic table’s most important pattern: the reactivity of elements. It does this by showing how electrons fill up shells, where full shells with a spherical distribution of charge are very stable. Here are some simple simulations made using
Interactive Physics that I have put together to show this electrostatic effect. Note that these simulations do not attempt to show any quantum mechanical effects. They are greatly simplified to focus strictly on the idea of the distribution of charge.
Deeper dive: the shell filling pattern breaks down. Shell filling follows a simple pattern until the transition metals are reached, where the energy levels of the 4s states are actually lower than the energies of the 3d states, causing the 4s states to fill before the 3d! Those wacky electrons. This happens because the 3d-orbital electrons spend more time farther from the nucleus due to their “eccentric orbits”, so the energy of the 3d-states is higher than the 4s.
Strength: electron shielding. Filled shells partially shield outer electrons from the attractive force of the nucleus. The Bohr diagram shows a circle of electrons that represents the spherically symmetric distribution of charge that is present in a complete shell. This is an important electrostatic effect that helps to explain the large atomic radius and the high reactivity of group one and two atoms in the periodic table (their loosely bound valence electrons are found far from the nucleus).
Weakness: orbital pairing of electrons. The pairing of electrons within an orbital is a quantum mechanical phenomenon, which makes it tough to visualize. It is typically shown in a Bohr diagram with two electrons drawn close to one another, in separate quadrants of a circular shell.
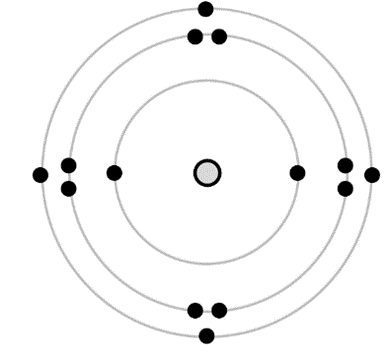
This representation bothers me because it undermines our electrical understanding of the atom. At the introductory level, electrical interactions are the most powerful idea for explaining the structure and behaviour of simple atoms and molecules: its scientific power is tremendous! The electrical interactions within the atom need to be constantly highlighted and reinforced. Electrons repel one another; close ones quite strongly! They will not be found huddling cheek-by-jowl together with their partner electron. When two electrons are in a 1s-orbital, for example, they still try to stay far apart! I am not aware of any pedagogical reason for showing the pairing of electrons in a Bohr diagram, the pairing derives from the spin of the electrons — an advanced and subtle concept. Drawing the electrons paired-up does not represent any phenomena the students already know and it does not help them explain or predict the behaviour of anything at all. So far as I can tell, it is just faulty science instruction. Furthermore, it causes the visual representation of a complete shell to appear less spherically symmetric.
Deeper dive: pairing of electrons. As explained by the founders of the VSEPR theory (Bader 1988, p.7331), the exclusion principle is responsible for a maximum of two electrons with opposite spin in a single orbital. Let's walk ourselves through this process. Start with one spin-up electron in the 1s orbital. The exclusion principle creates a “no go” zone for other spin-up electrons so they cannot find a stable state in the space corresponding to the 1s orbital (remember, there is no classical analog to this exclusion effect; it as an empirical fact of the microscopic world). A spin-down electron is not limited by this, so a single spin-down electron can also occupy the stable 1s orbital state. Now the exclusion principle creates a similar “no go” zone for spin-down electrons. The result is all other electrons (both spin-up and down) are excluded from joining the first two electrons in the 1s orbital. Despite being in the same atomic orbital, nothing prevents the two electrons from interacting electrically, so they repel one another. They are not localized in a small region of space as suggested visually by the pairings in Bohr diagrams. “Pairing-up” is less of a side-by-side, pairing-up-with-your-buddy situation and more of a “you two are allowed in the same room together, just stay in opposite corners” situation. However, when bonding takes place, a pair of electrons can end up much more tightly packed into a small region of space due to the powerful combined electrical interactions of two nuclei. This is perhaps the pairing that people think of when drawing Bohr diagrams, but this pairing does not take place for isolated atoms. This is likely an accidental pedagogical mixing of atomic and molecular orbital ideas that should be untangled! Here is a classical simulation showing two electrons “caught” between two nuclei. The two electrons end up confined in a small region of space by electrostatic forces.
Weakness: shell filling sequence. Since shell filling is so important for explaining trends in the periodic table, we feel obliged to represent partially filled shells in Bohr diagrams. However, the common practice is to introduce rules that are either pointless or incorrect. Typically, we show electrons added one by one into a shell until we reach the fifth electron where we begin to pair them up until the shell is full.
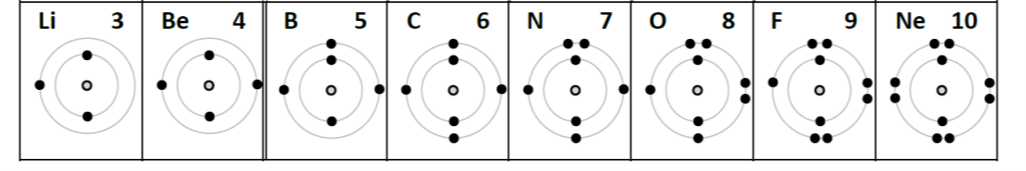
It bothers me when we ask students to learn something that is both wrong and only useful for earning marks on a science test. The orbitals that comprise shells are actually filled according to energy, from lowest to highest.
Deeper dive: the multi-electron atom. As soon as multiple electrons are present in an atom, the different orbitals within a shell (the sub-shells) acquire different energy values; they are no longer degenerate (all the same energy) as they are in the hydrogen atom. This happens because of the partial shielding of the nucleus due to other electrons and electron-electron repulsion.
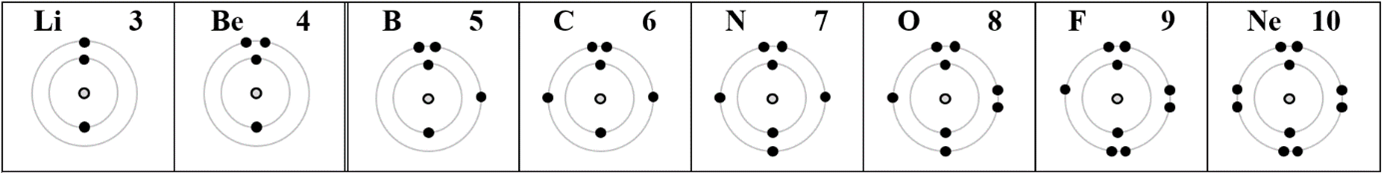
The sequence of adding electrons to fill the second shell according to increasing energy actually goes like this: 2s, 2s, 2p
x, 2p
y, 2p
z, 2p
x, 2p
y, 2p
z. We see that the first and second electrons of the second shell get “paired” and the next one to pair is the sixth (with the third) — that’s a different pattern than the diagrams above! Here is what it should look like if the science of pairing matters:
 Weakness: drawing a large nucleus.
 I have seen versions of the Bohr diagram drawn with a large nucleus, large enough for students to write in the number of protons and neutrons. This is sloppy since it leaves the impression that the nucleus takes up a considerable volume of the atom. It should always be visually clear that the atom is mostly empty space!
Weakness: atoms with many electrons. It’s just a pain to draw Bohr diagrams for these! As a result, students in higher grades tend to use more efficient representations such as Lewis dot diagrams that focus exclusively on the valence electrons. And if Bohr diagrams are not much used beyond grade 9 science, how much should we emphasize them? Do they provide much educational bang for our teaching buck?
The judgment of Bohr diagrams
Are Bohr diagrams useful scientific and educational tools? They do help us picture several important concepts that explain the behaviour of atoms in simple ways. My current practice of drawing the diagram does introduce misconceptions and misses opportunities to reinforce electrical ideas. They are not widely used at higher levels of study because they are cumbersome and are replaced by more efficient representations. Overall, Bohr diagrams seem to have the role of training wheels: beneficial early on when establishing core understandings but are abandoned as conceptual security develops.
Multiple representations of the atom
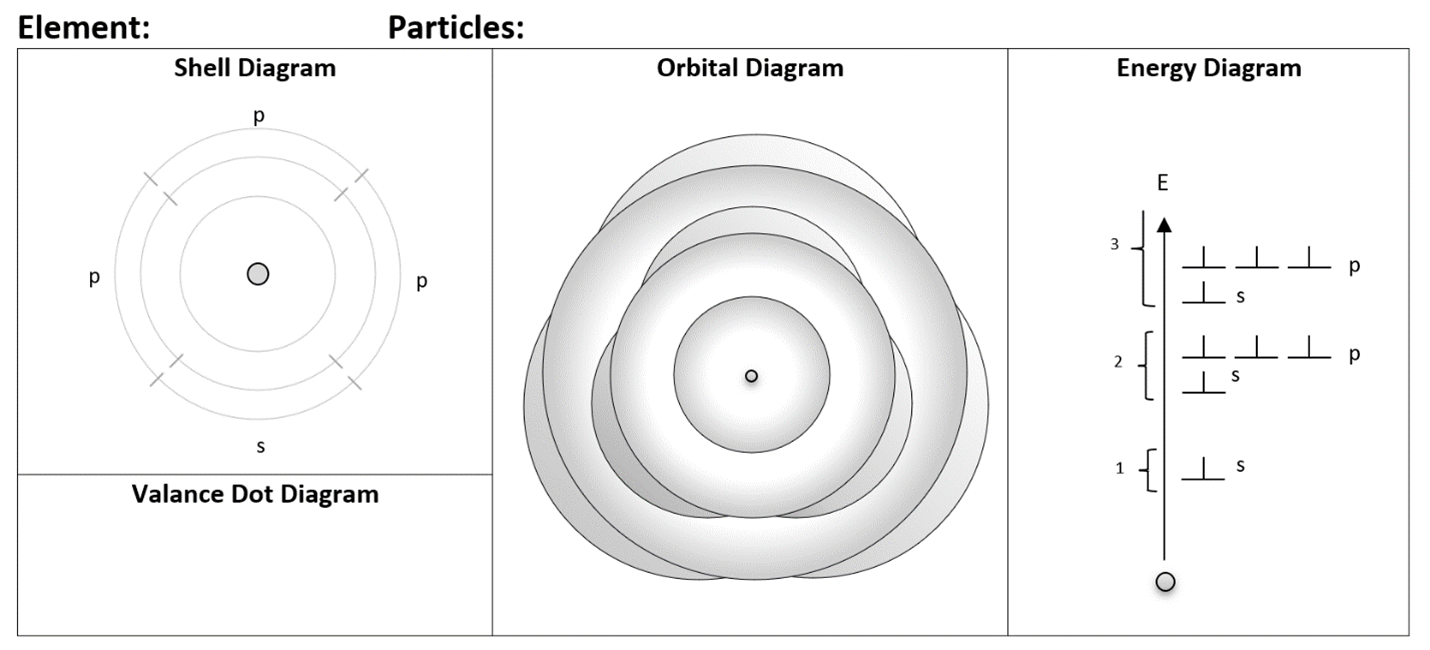
For my grade 9 science class, I want to reinforce connections between students’ understanding of static electricity and the structure of the atom, allowing students to easily explore the electrical behaviour of the atoms and molecules they encounter in higher grades. I propose the continued use of Bohr diagrams in a modified form and with multiple, complementing representations. Every representation of the atom has limitations, but some of these limitations can be overcome using a combination of representations that reinforce key ideas and highlight unique ones. In educational research this is called using “multiple representations”, an approach that helps improve and deepen student understanding. Now I will present a set of representations for the atom, but with a proviso: I have not used these in the classroom, so I don't actually know what parts would be appropriate for what grade level! They just represent me grasping for solutions to the atomic representation problem. I'll let you peruse them first before I explain them.
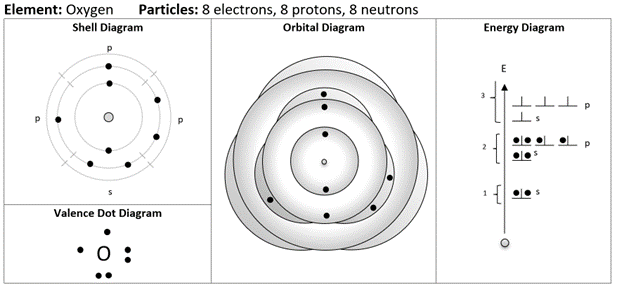
The combination of diagrams you see in this example represents a template. Once students are introduced to each diagram, they would routinely complete the set of diagrams together. Let’s walk through these diagrams and I will share with you the thinking behind them.
A simple modification: the shell diagram
Here I have taken the Bohr diagram and added tick marks to conceptually denote the subshells in the atom. This helps represent the idea that there are defined regions of space where the electrons can be found that can hold up to two electrons. I have added labels s and p, which might be glossed over for beginning students aside from a simple explanation that one starts with the s-subshell, fills it up, and continues with the p-subshells; maximum 2 per subshell! The electrons are spaced out evenly in the subshells, reminding us of their electrostatic repulsion. Also notice that the spacing between successive circles, representing the shells, become smaller; representing the differences in the energy levels getting smaller.
Bohr with vitamins: the orbital diagram
Here I have made substantial changes to the traditional Bohr diagram. Each orbital is separately drawn and is given a bit of shading to suggest that is it three-dimensional. In the middle, we can see the 1s orbital represented by a shaded “sphere”. Electrons within each s-orbital are positioned as far apart from one another as possible due to their electrostatic repulsion. The 2p orbitals are represented by an elliptical cloud and can be seen poking out beyond the 2s orbital. There isn’t much room in the diagram to space out a pair of 2p electrons, so we do the best we can. All these diagrams are designed to include electrons up to the 3p orbitals. After that, things get more complicated as explained below!
Deeper dive: the role of the outer orbital. The outermost orbital (the one that sticks out the farthest) helps to determine the behaviour of an atom. For example, the orbital diagram above shows that electrons in a 2p-orbital can be found farther from the nucleus than those in the 2s. This helps to explain why an element like boron (1s2 2s2 2p1) behaves in a significantly different way than both lithium (1s2 2s1) and beryllium (1s2 2s2): boron’s 2p electron pokes out beyond the 2s-orbital and can easily interact with other atoms. When we get to the transition metals, the 3d electrons are tucked in underneath the 4s orbital and do not easily interact with other atoms since they are no longer the outermost electrons. This spatial arrangement of the orbitals helps to explain why the properties of the transition metals are so similar: they are dominated by the electrical interactions of the outermost orbital, the 4s.
Why bother picturing the atom: the energy diagram
Here is a diagram that should look familiar: my version is quite close to what is commonly found in chemistry textbooks. This diagram completely ignores the spatial layout of the electrons and focuses on energy (which is closely related to distance from the nucleus). Notice how this diagram can be easily upgraded to include the up or down spin of electrons: nothing needs to be unlearned, just refined. Perhaps this diagram by itself is better than any type of Bohr diagram including my modified versions: it shows complete shells, the correct order of filling shells, and the relative energies of the shells while avoiding the fuss of the angular distribution of the electrons around the nucleus. The downside is that it no longer feels like we are drawing “the atom”.
Move over Lewis: the valence dot diagram
This is my version of the Lewis dot diagram: I prefer the descriptive name rather than the Lewis name for these. The only difference in my version of this diagram is that it should be consistent with the other representations. As such, it should show the same pattern of electrons filling the outer shell which starts by “pairing up” the 2s-orbital electrons, exactly copying the pattern of valence electrons that is seen on the shell diagram. A carbon atom represented this way looks like this:
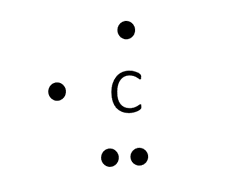
This might cause the brow of chemistry teachers to furrow, but I think it highlights an important foundational idea when we draw single atoms: we are picturing the electrons in atomic orbitals and not molecular ones where electrons can be found localized in pairs. It could be pedagogically useful, even at an early stage, to bring up the idea that the
electron configuration changes from atomic to molecular when atoms bond.
Deeper dive: the carbon atom in methane. When forming methane, the central carbon atom will change from: 1s2 2s2 2px1 2py1 to 1s2 2s1 2px1 2py1 2pz1, which requires a little kick of energy that is often not described. In fact, this is a conceptual step that is often overlooked when discussing the process of bonding: an input of energy is required to start the bonding process. For example, a lithium atom needs to gain a small amount of energy for its single valence electron to be removed from its nucleus.
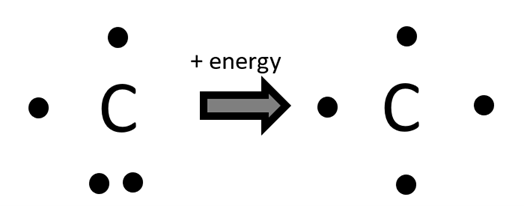
Perhaps the traditional Lewis dot diagrams should be reserved for situations involving bonding. Since the electrons are drawn in very close pairs, this suggests the greater localization of electrons during bonding when the powerful attraction of two nuclei can bring a repelling pair of electrons close together. See the previous simulation above!
Deeper dive: VSEPR lone pairs. In the VSEPR theory of molecular structure, lone pairs of valence electrons (ones that don’t bond) are spread out at greater angles than bonding pairs: the two electrons in the lone pair are still strongly repelling one another (Gillespie, 2008). So what we draw as a closely spaced pair of dots hides the repulsion that is taking place!
A new hope for atomic representations
Multiple representations encourage students to sort through their conceptual thinking about a topic. Drawing one specific diagram can become a rote process with little critical thinking. By routinely drawing multiple representations of the atom, students are more likely to sort through the concepts being used with each. The hope is that using multiple representations is not too time consuming or confusing for students. As I mentioned before, these suggestions are not classroom tested. I have a hunch that some (or many) of these ideas are better suited for grade 11 or 12 chemistry rather than grade 9 or 10 science. In any case, to help students as much as possible, a blank template for the multiple representations should be provided.
The individual representations should be introduced in a very simple manner, ideally in close succession so students practice using them together. After learning the representations with very simple atoms, students can then use them to explore more challenging atoms. Normally I ask my grade 9 students to draw Bohr diagrams for the first 20 elements; using multiple representations, this would be very tedious! Along with multiple representations goes an educational philosophy of focusing on a smaller number of examples and exploring them in greater depth or detail with a focus on sense-making. This works well when the level of technical challenge of the diagrams is not too high; otherwise, it can become cognitively overwhelming for student to tackle complex situations while struggling with their basic representation skills.
An experiment in learning
I am now at the point of wondering about how to integrate these ideas into my grade 9 unit on the atom — I haven’t decided! But I am more and more annoyed each year as I teach faulty ideas in the traditional Bohr diagram. I might just stop drawing paired electrons! In any case, I hope you have found this article interesting and find yourself interested in exploring these representations yourself. Try an experiment in learning the next time you teach the topic of atomic structure. If you do, please let me know, I would be intrigued to see how these ideas work out. Good luck!
References
- Bader, R. F., Gillespie, R. J., & MacDougall, P. J. (1988). A physical basis for the VSEPR model of molecular geometry. Journal of the American Chemical Society, 110(22), 7329-7336
- Gillespie, R. J. (2008). Fifty years of the VSEPR model. Coordination Chemistry Reviews, 252(12-14), 1315-1327.
- Moore, Justin Shorb, Xavier Prat-Resina, Tim Wendorff, E. V., John W., & Hahn, A. (2020, November 5).
- The Wave Nature of the Electron. Retrieved June 9, 2021, from https://chem.libretexts.org/@go/page/49286
- Ogilvie, J. F. (2017). The hydrogen atom according to relativistic wave mechanics--amplitude functions and circulating electronic currents. arXiv preprint arXiv:1709.04338
Tags: Pedagogy, Quantum