Eric Haller, Editor-in-Chief of the OAPT Newsletter, Peel District School Board
eric.haller@peelsb.com
Robert Prior, ePublisher of OAPT Newsletter
science@robertprior.ca
There’s a lot of physics hidden in the grade nine curriculum, if you know where to look. For example, the inverse-square law appears in the space unit, as part of the reason scientists know how far away stars are. It is often presented as a given, but deriving it from experimental evidence is a neat way to use a hands-on activity to show the process of science.
How did physicists measure light before they had photometers? John Joly, FRS, invented a comparative photometer over a century ago. We’ve used this simple device to explore the inverse-square law in a totally low-tech way.
What is a Joly Photometer?
The Joly photometer consists of two identical wax (or translucent plastic) blocks separated by an opaque layer, placed between two light sources. It is easy to see which light source is brighter by looking at the blocks.
Making a Joly Photometer
A basic Joly Photometer can be made with two wax blocks separated by a piece of aluminum foil, but better results can be obtained with a slightly more sophisticated model. Here is how to make a good Joly photometer.
Get some blocks of paraffin wax. Any shop that sells canning supplies, like Canadian Tire, should have some in stock. There can be slight variations between wax blocks, even from the same package, so for best results use a single block cut in half.
Cut a piece of aluminum foil to the size of the blocks and place it between the blocks, like the filling in a sandwich. To protect the wax from handling, and also to block stray light, wrap foil around three edges of the sandwich, and wrap a piece of card around that. Hold everything together with a rubber band.
To test it, place the photometer exactly between two equal light sources and check that the two blocks are the same brightness. This will be easier to see if you shield the light sources so you can only see the photometer.
If there is a difference in brightness between the two sides of the photometer, try flipping it 180° (so AB becomes BA). If the brightness difference also flips then you know that the wax blocks are not identical and the photometer needs to be remade. If the brightness difference stays the same then your light sources aren’t identical (or there is too much stray light in the room).
Testing the Inverse-Square Law
Materials needed:
- Joly photometer
- ruler or metre stick
- uniformly bright light sources (we used identical candles, but other lights could be used as long as they are identical)
Place the photometer between two light sources and adjust the distances until the brightness in each half is the same. The sources now have the same apparent brightness. By adjusting the brightness of one source, and the distance between source and photometer, we can gather the data to test the inverse-square law.
We have tried two methods: keeping the distance between sources the same and moving the photometer, and keeping the distance from one source to the photometer the same and moving the other source. The former requires less space but is harder for students to understand as the distance data needs to be normalized, so we recommend the latter (especially in a destreamed class). Use whichever method works best in your classroom.
Place one light source a defined distance from the photometer as the reference light source. How far depends on the brightness of the light sources and how much ambient light your classroom has— we’ve used 3 cm for candles and 20 cm for light bulbs, so try it out to see what works best in your setting. Then place increasing numbers of light sources on the other side, adjusting the distance until the photometer shows equal brightness (it is easiest to move candles if they are on a ruler). Record the larger distances required for each increase in brightness (number of candles).
Analyzing the Data
Students should organize their data in a table similar to the one below. Entries in blue should be the same for all groups, while entries in red will vary somewhat between groups. Assuming good data collection (i.e., a dark room and reasonably careful students) it should be evident that one light source set a base distance away from the photometer would have the same apparent brightness as four light sources at twice the base distance, or nine candles at three times the distance (note: nine candles might be too many to safely use, depending on your classroom).
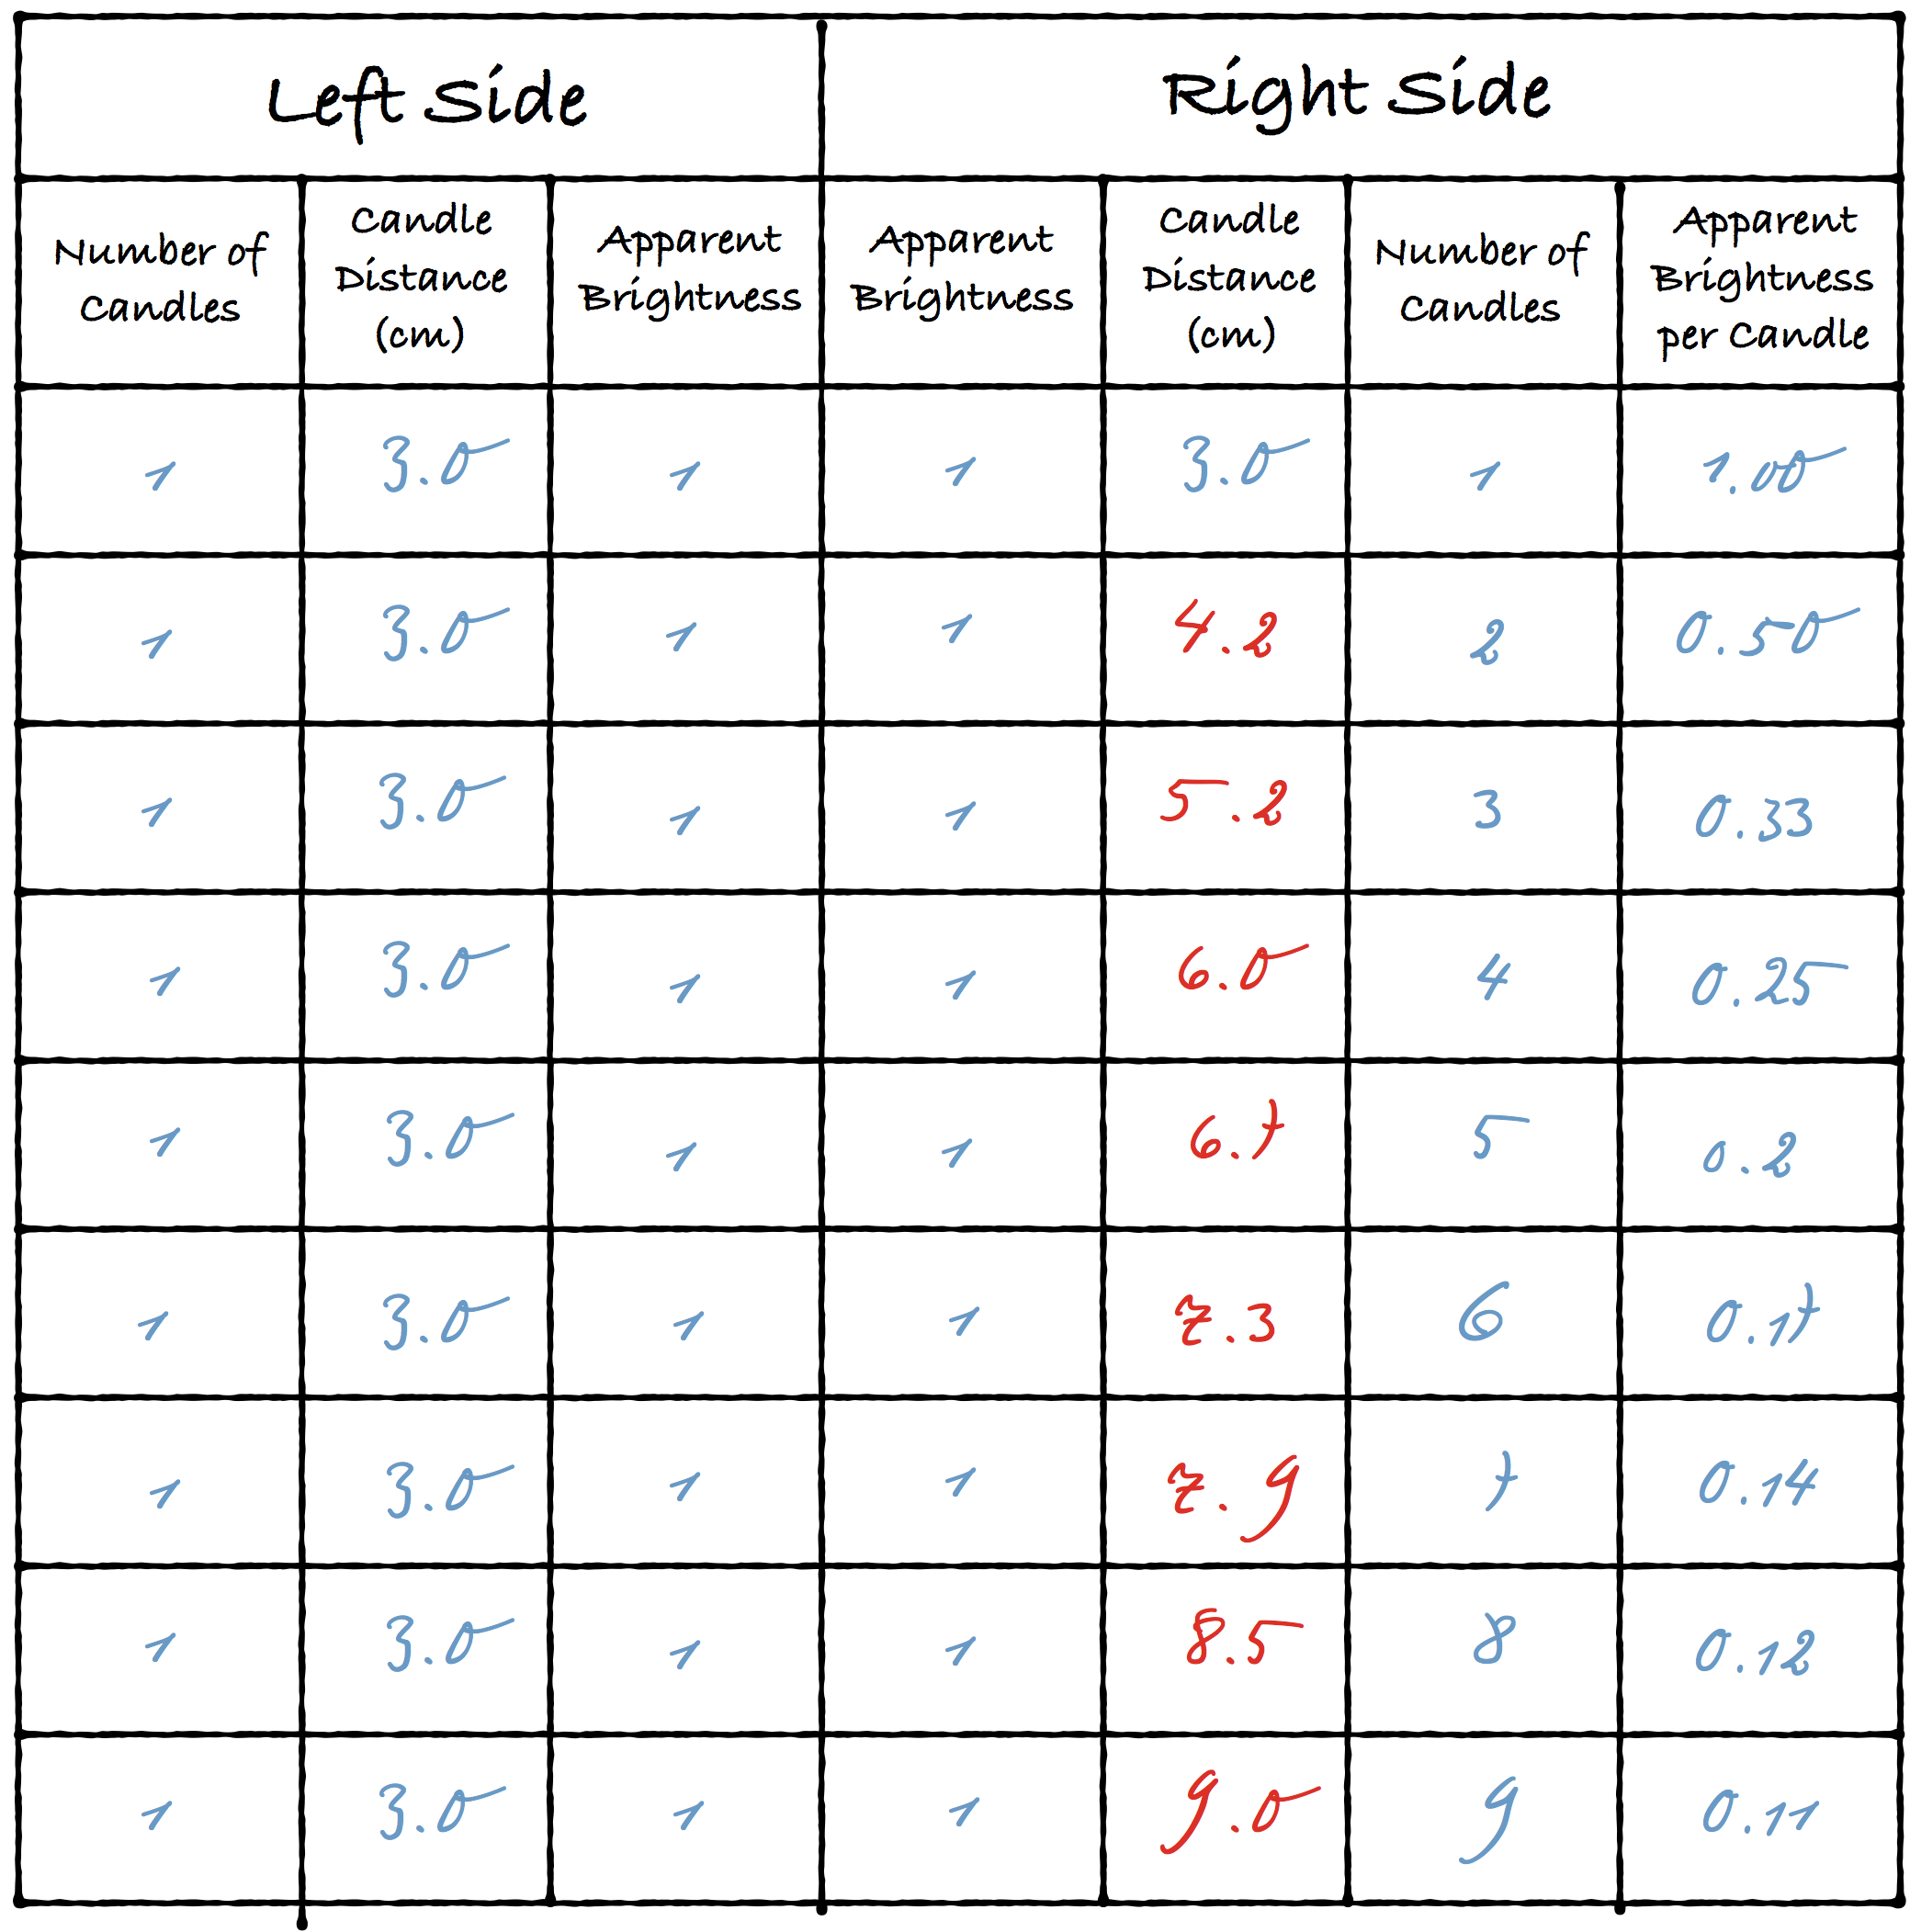 (Note: for a bit of fun, we used Albert Einstein’s handwriting to enter the data.)
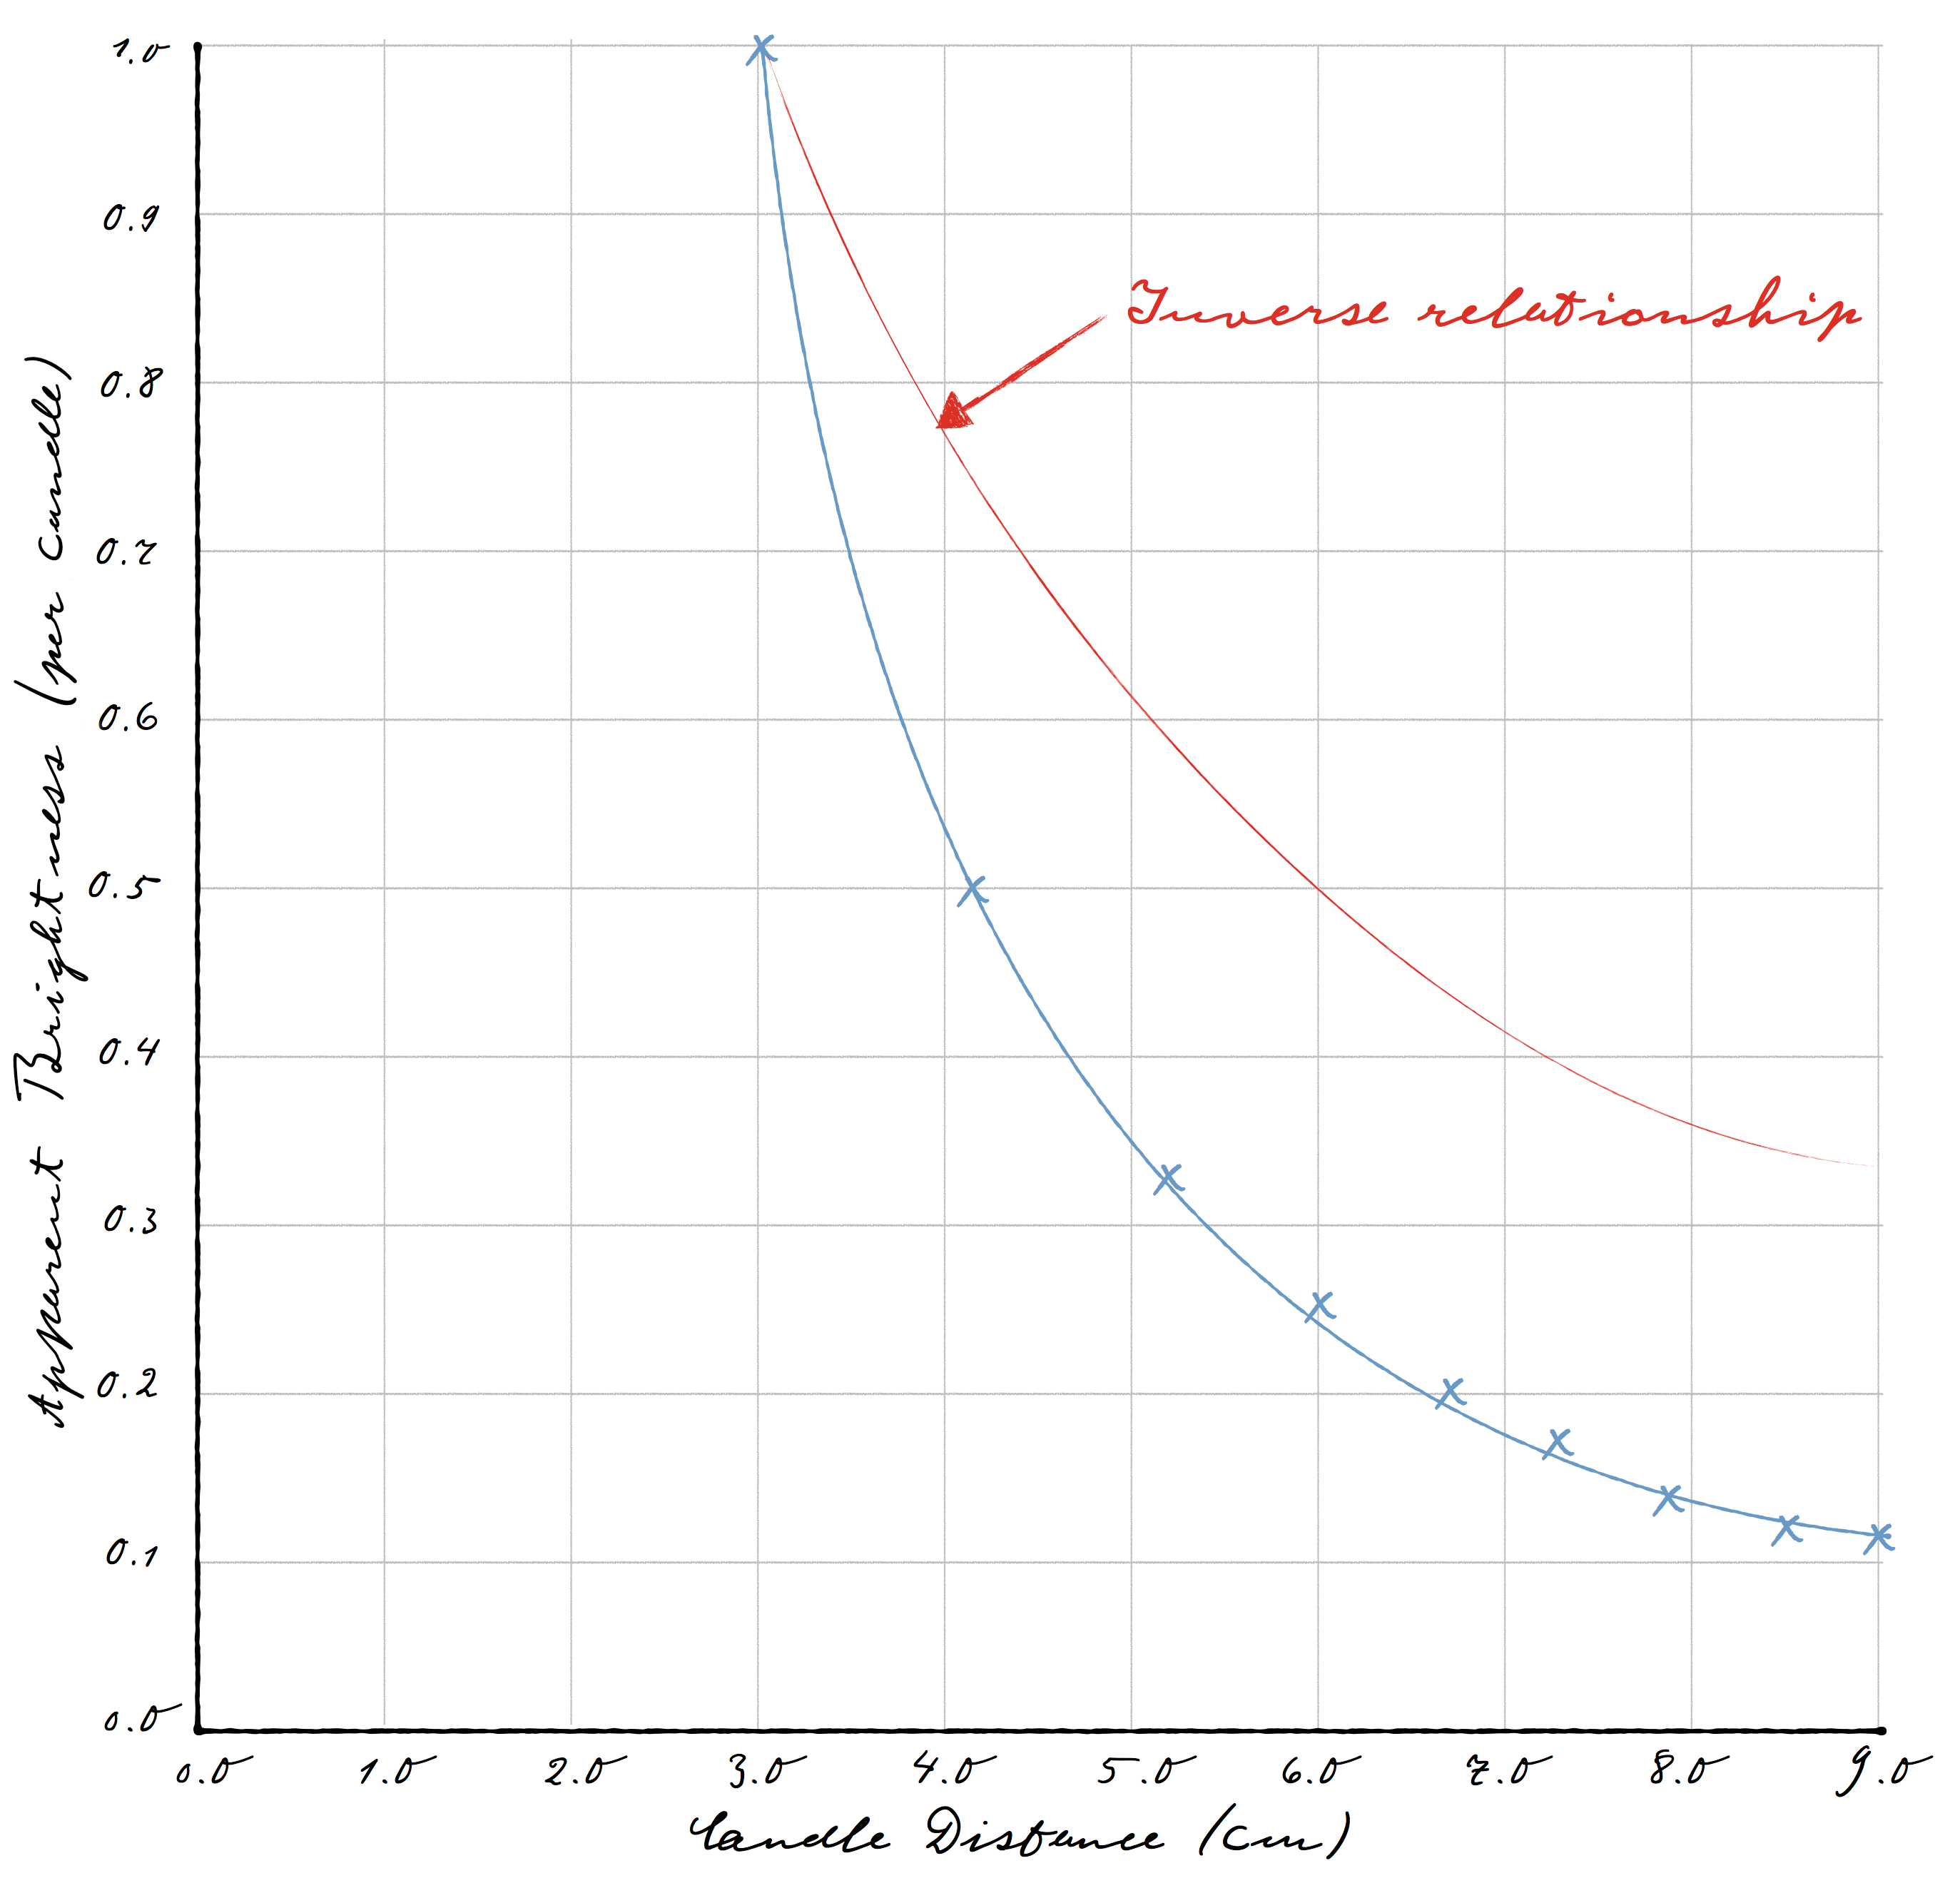
Graphing apparent brightness per candle vs candle distance will show that the relationship is not a simple inverse relationship — twice the distance is not half the brightness.
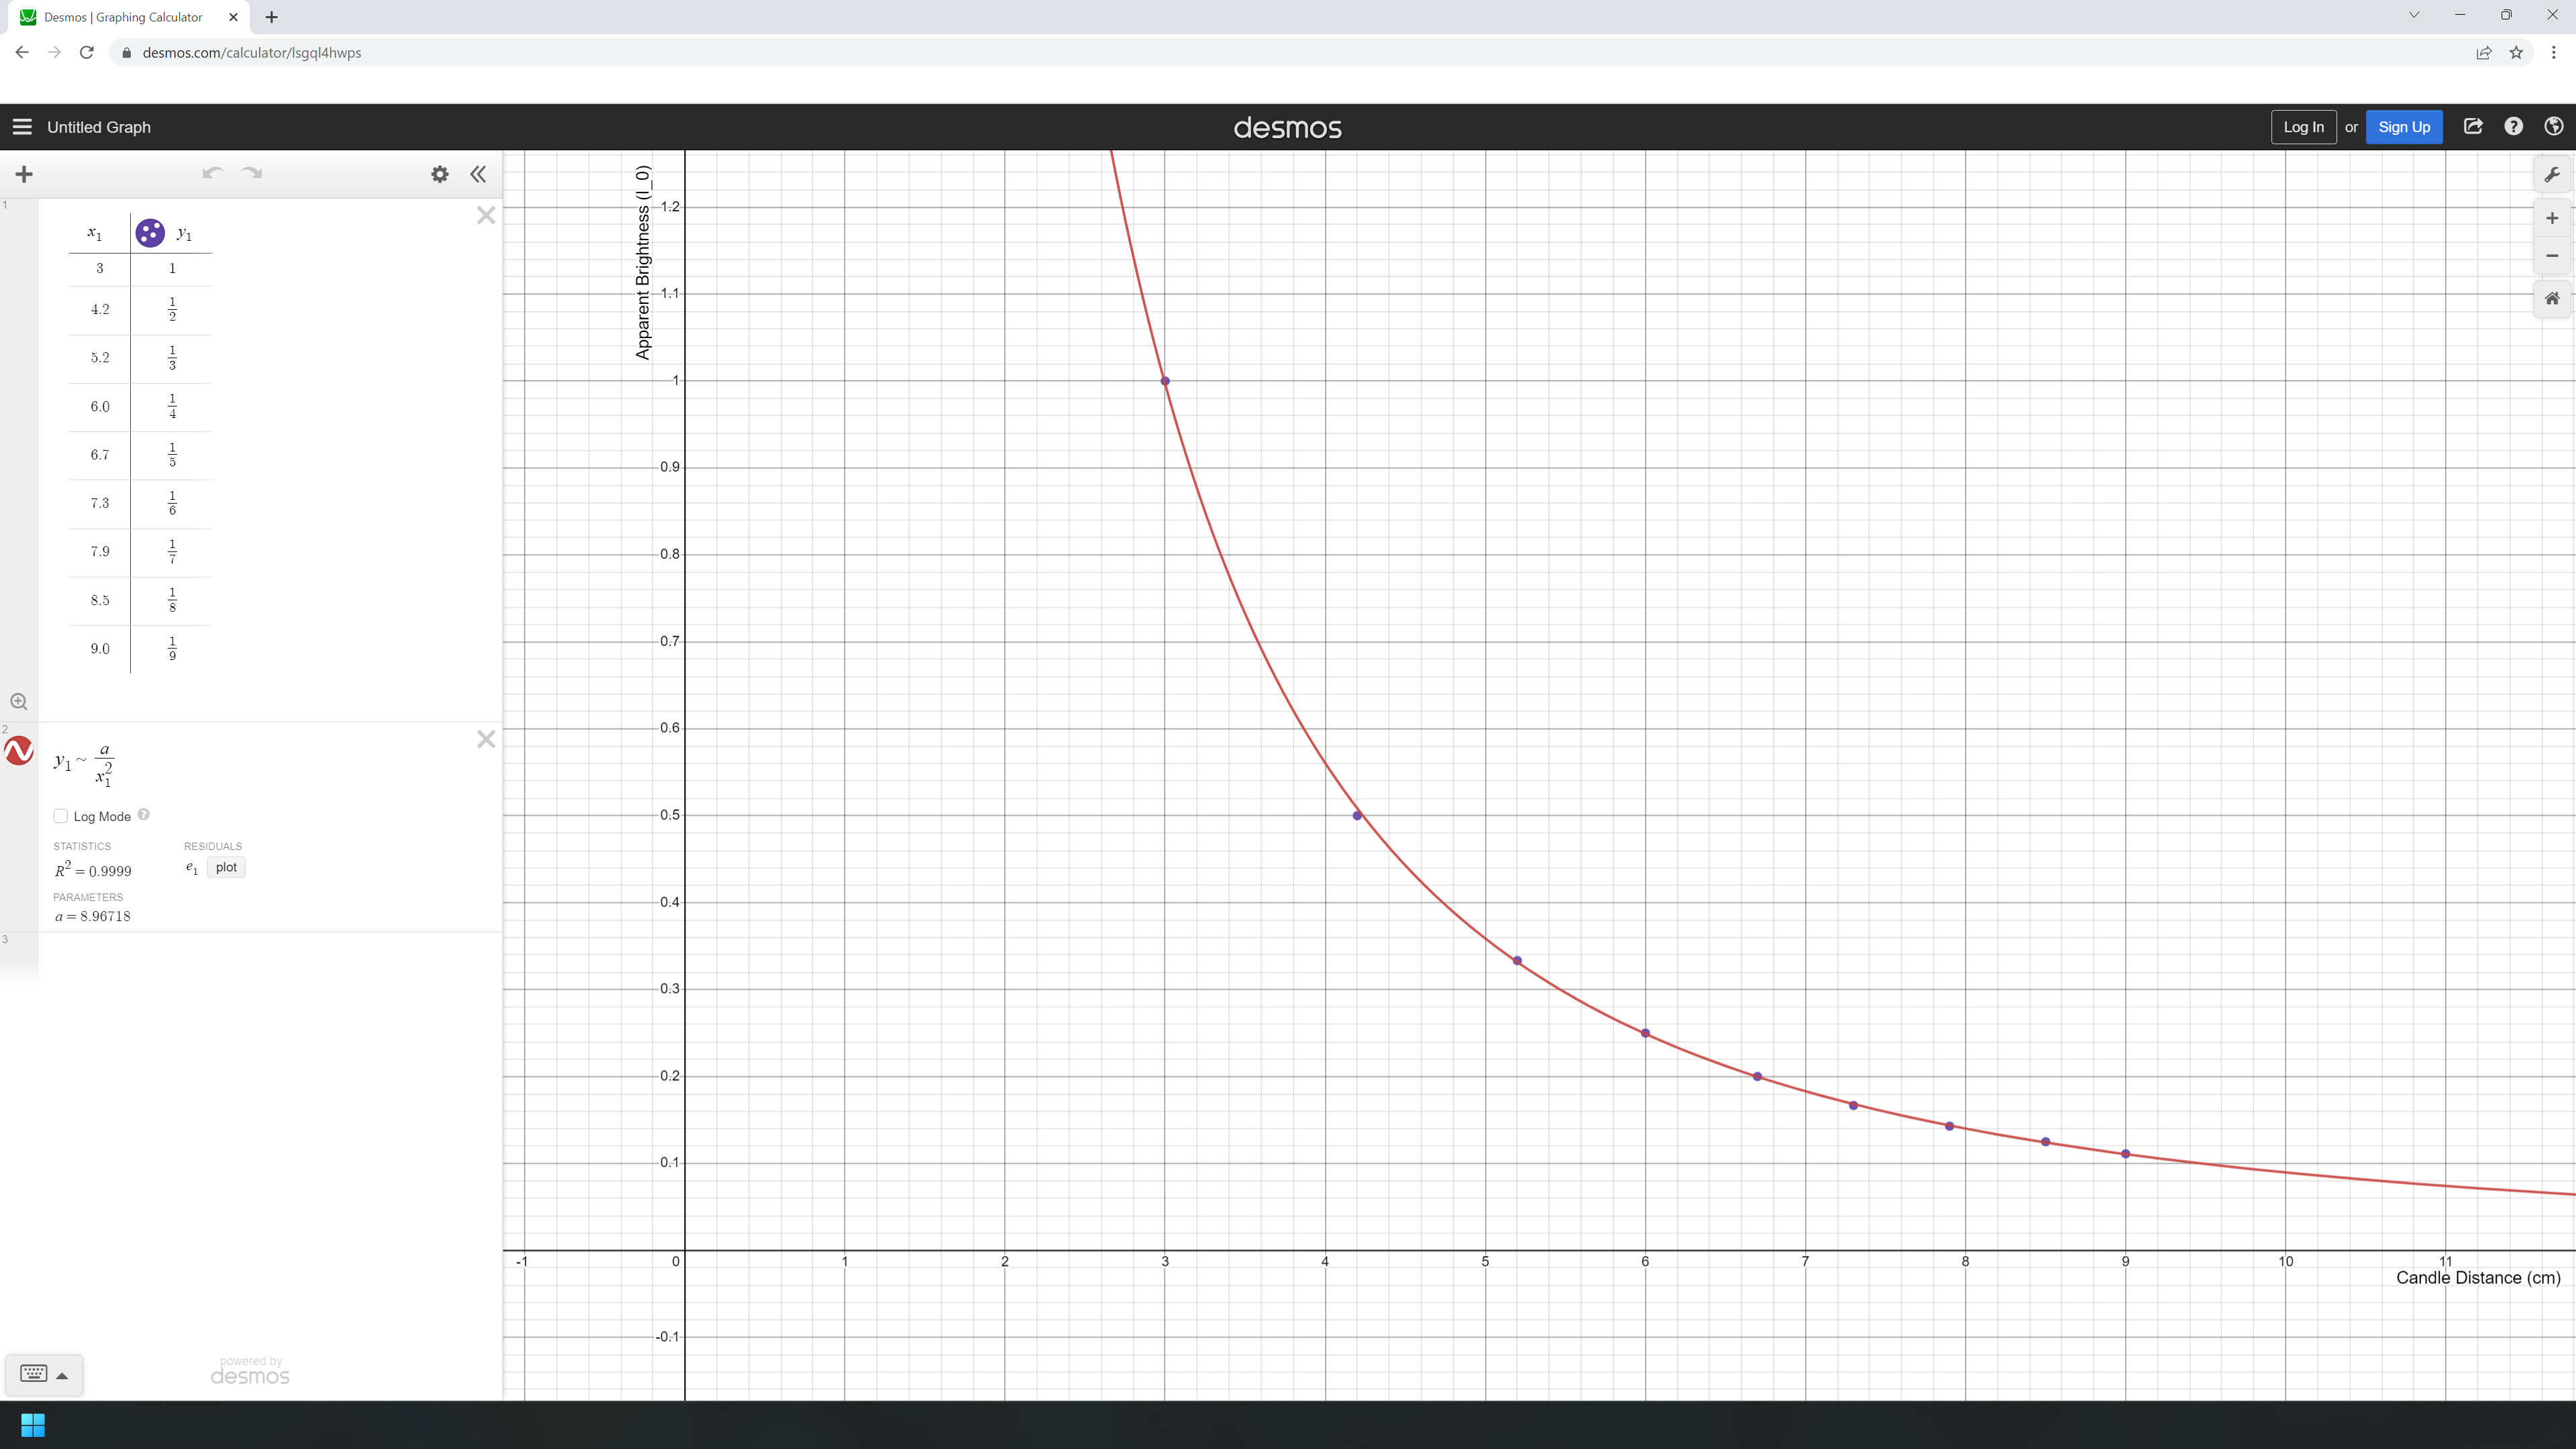
As the distance increases, the brightness should drop off in a 1/r² relationship. Here’s a graph of the data in
Desmos. By typing
y_1~a/x_1^2 into the second line, Desmos will do a 1/r² curve of best fit.
 An Alternate Approach to Using the Joly Photometer
This video illustrates how to make and use a very simple Joly Photometer. It assumes the inverse square law is correct and uses it to calculate relative brightness. As a follow-up activity, students could work in pairs and try to measure how much stronger one person’s cell phone flashlight is compared to their partner’s phone. Alternatively, students could place a candle 3 cm from the wax and move their cell phone until the two wax blocks are equally bright, which could tell you how bright their phone’s flashlight is, in units of candles (this is roughly one ‘candela’, and what better way to introduce the SI unit of luminous intensity is there than this?). Students could even write their phone’s make, model and brightness on the chalkboard, so that students could compare the quality of their phones’ flashlights.
Ontario Expectations
This activity can be used as part of expectations E2.5 and E2.6 in the
2022 Grade Nine De-Streamed Science (SNC1W) curriculum, as well as A1.1, A1.2, and A1.5.
Tags: Astronomy, Destreamed, Light, STEM