Robert Prior, teacher at Agincourt CI
robert.prior@tdsb.on.caMany of us find marking tests a necessary chore. It has to be done, but it’s drudgery. This article describes how I use an app and the Ontario Achievement Charts to mark tests 2-3 times faster, as well as analyze the results.
I have two problems marking tests. I am mildly dyslexic with numbers, so often make mistakes adding marks even when I’ve double-checked everything. More significantly, like
Cynthia from PhD Comics, I spend way too much time trying to decide part marks: is this question 7 or 7.5 out of 10? 1.5 or 2 out of 3?
A while ago I
reviewed a cool app called
ZipGrade which turns your phone or tablet into a Scantron machine for multiple choice tests. ZipGrade has been upgraded so you can design custom answer sheets, which in turn has let me use it for all my test questions. This means I no longer need to add up marks, which saves many mistakes.
To speed up assessing part marks I made two changes to my tests.
Every part of a problem is a separate question
I split problems (and essays) into multiple parts: one question for each item that I am marking. This means my average problem is actually several questions. If, for example, I want students to describe the motion in physics words, sketch a motion graph, list the given information, and so on then I make each of those requirements a separate question for the purposes of marking. This means I am only thinking about one part of the solution at a time. As an added bonus this makes it explicit what I am looking for in a solution, so I get fewer students arguing “I didn’t know you wanted that”.
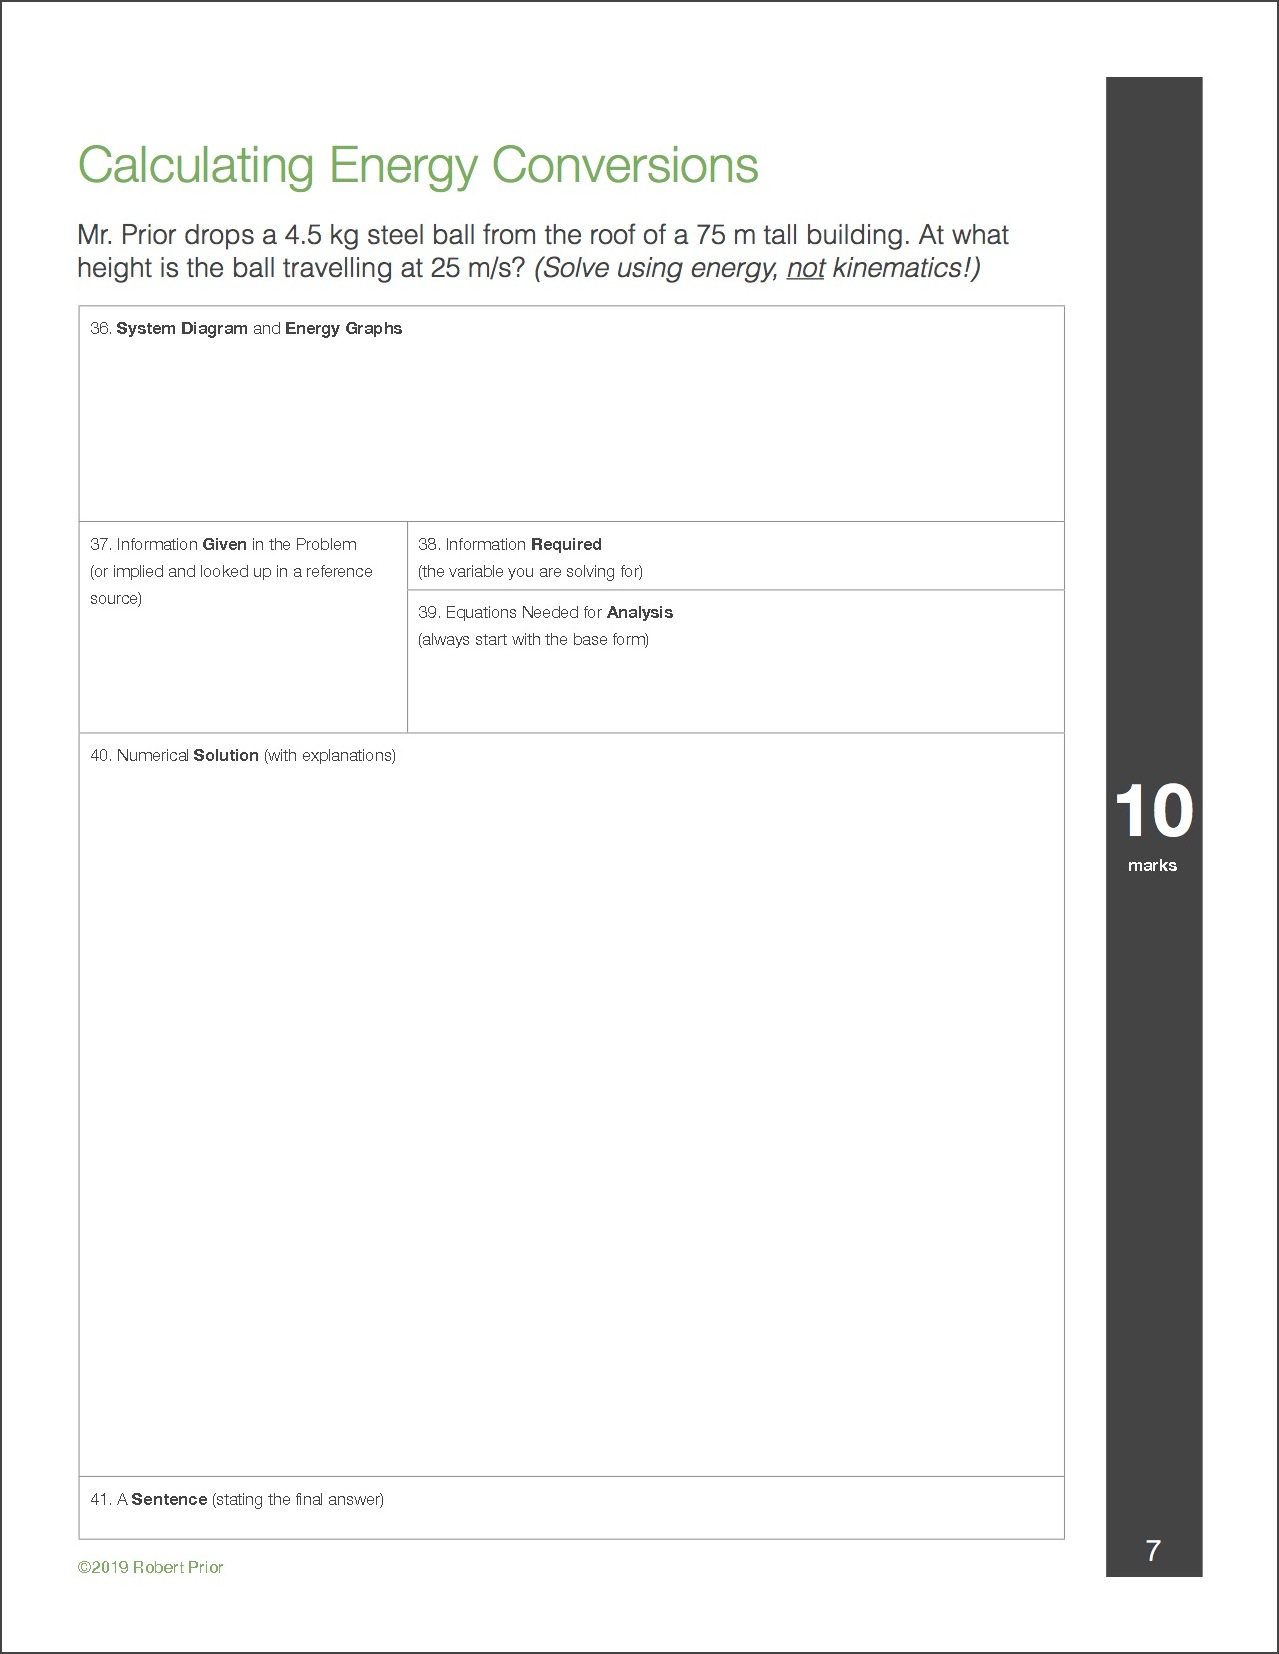 Figure 1: Sample Test ProblemEvery question is marked with levels
I also mark each question using the Ontario Achievement Levels. Rather than worry about part marks I only have to decide which level best describes the student’s response. Thinking about the response descriptively (“do these diagrams show some skill or considerable skill?”) is easier than thinking about a scale (“are these diagrams worth 3/5 or 3.5/5?”).
This is where the custom answer sheet comes in. For every test I create a custom sheet with the usual bubbles for multiple choice questions, and a custom set of bubbles for levelled questions (which I mark). This is done using the “alternative answer” feature of ZipGrade. (You can find a short tutorial
here.)
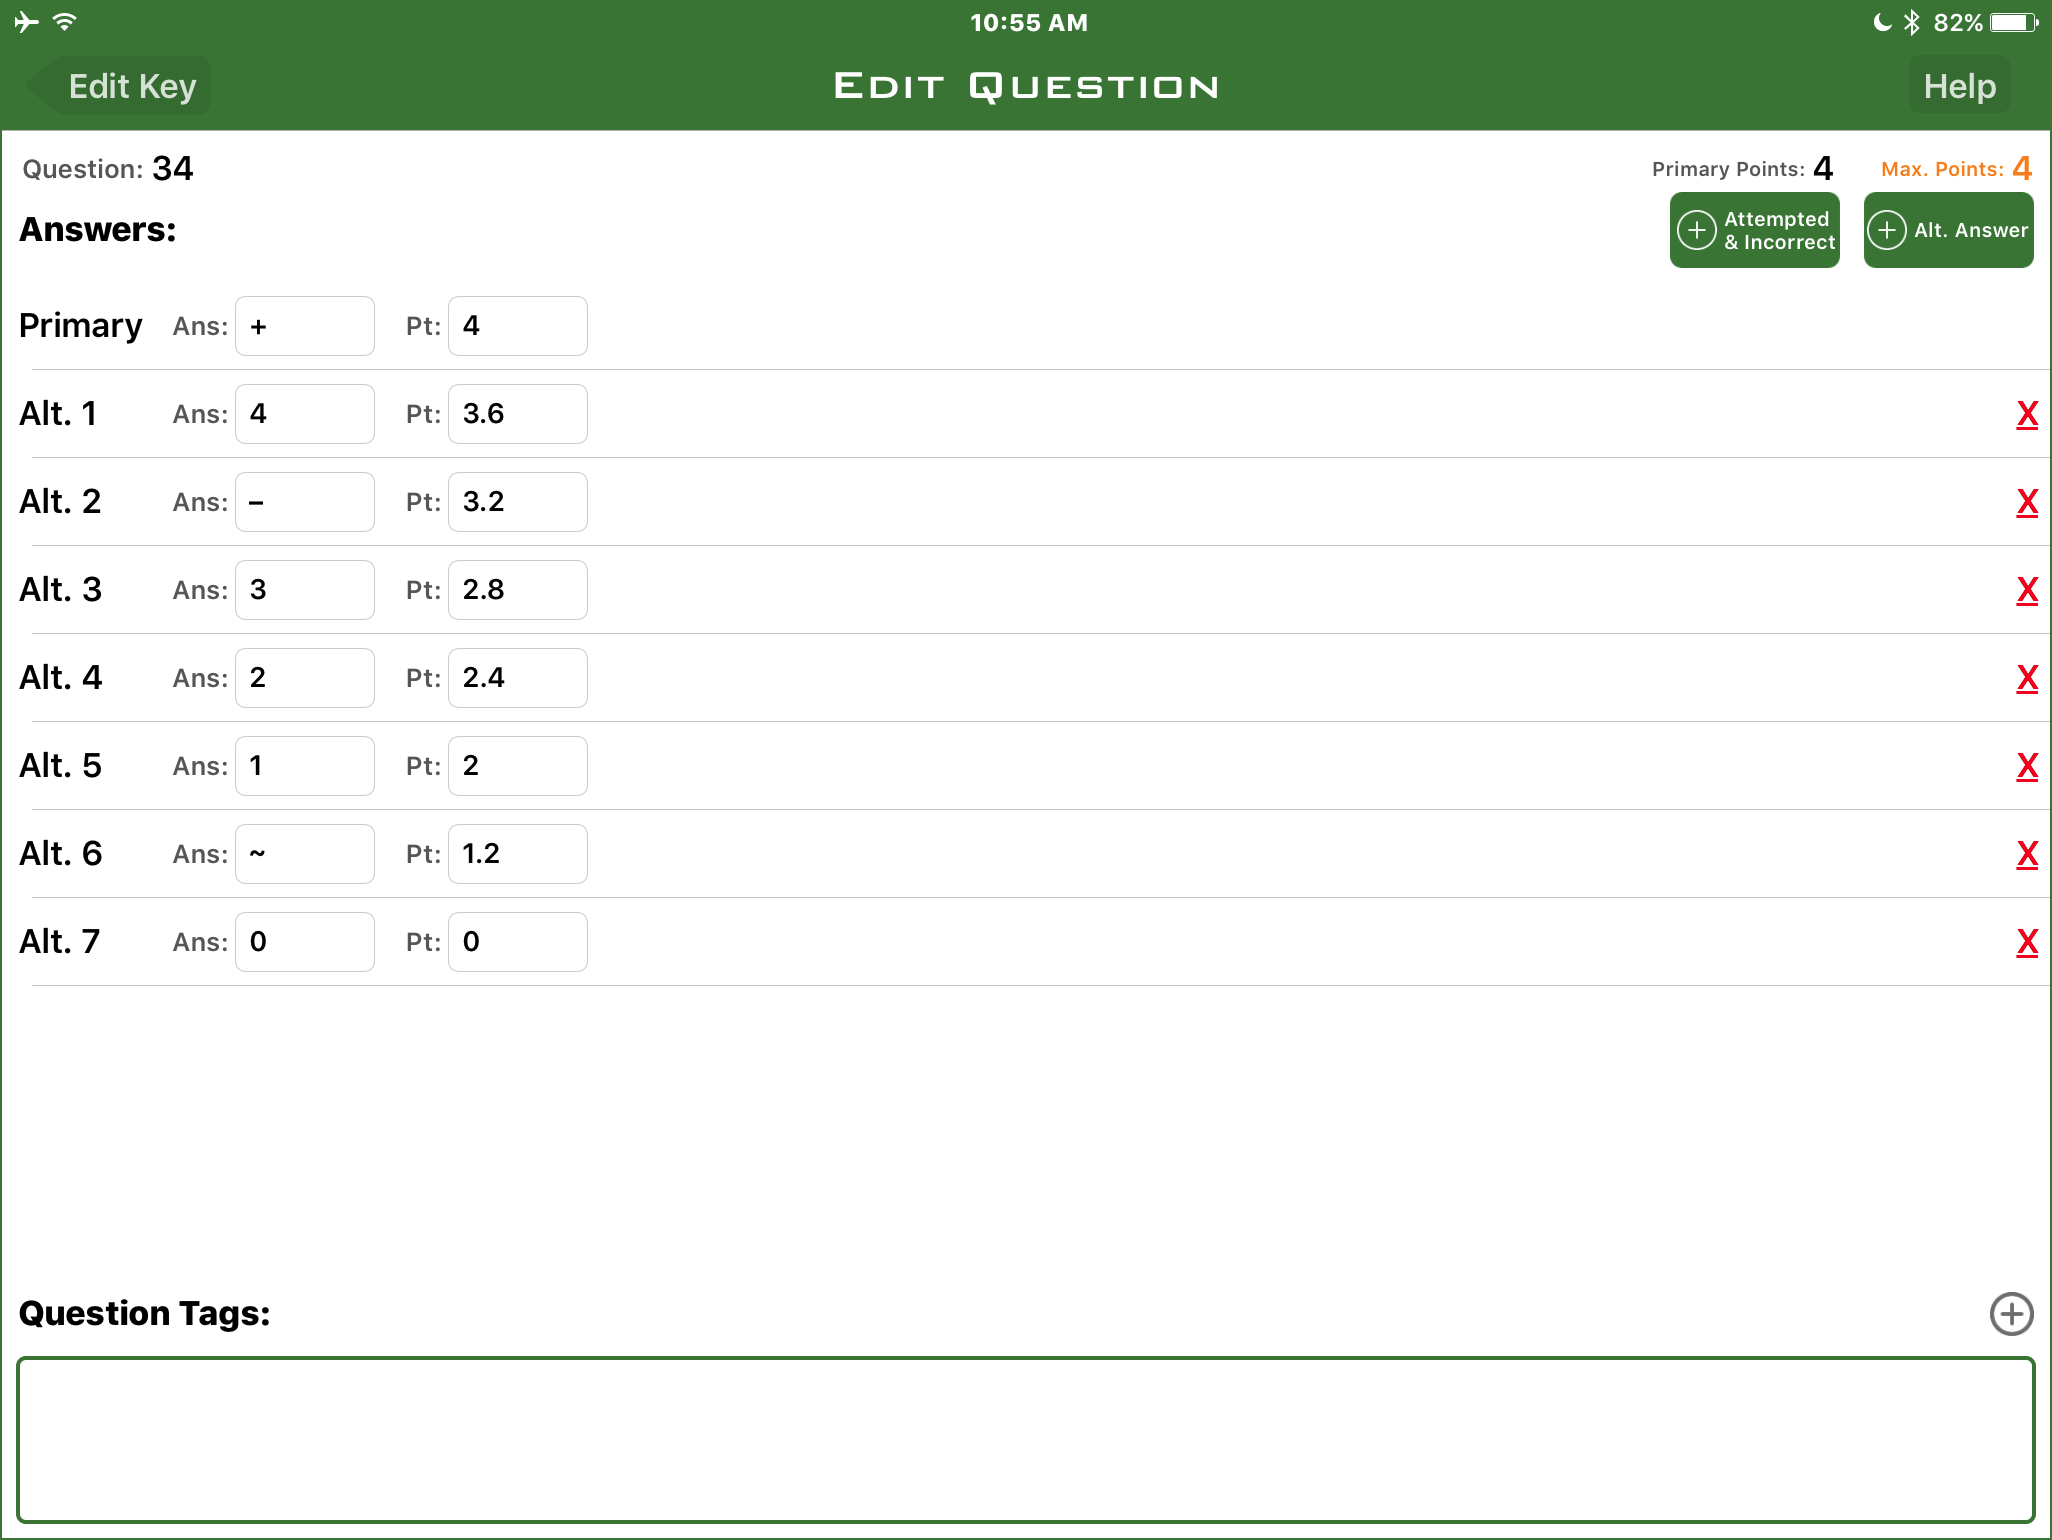 Figure 2: Alternate Answers in ZipGrade
During the test students bubble their answers for multiple choice questions; after the test I mark the other questions and bubble the rest of the sheet. ZipGrade takes care of translating those levels into part marks and adding them up.
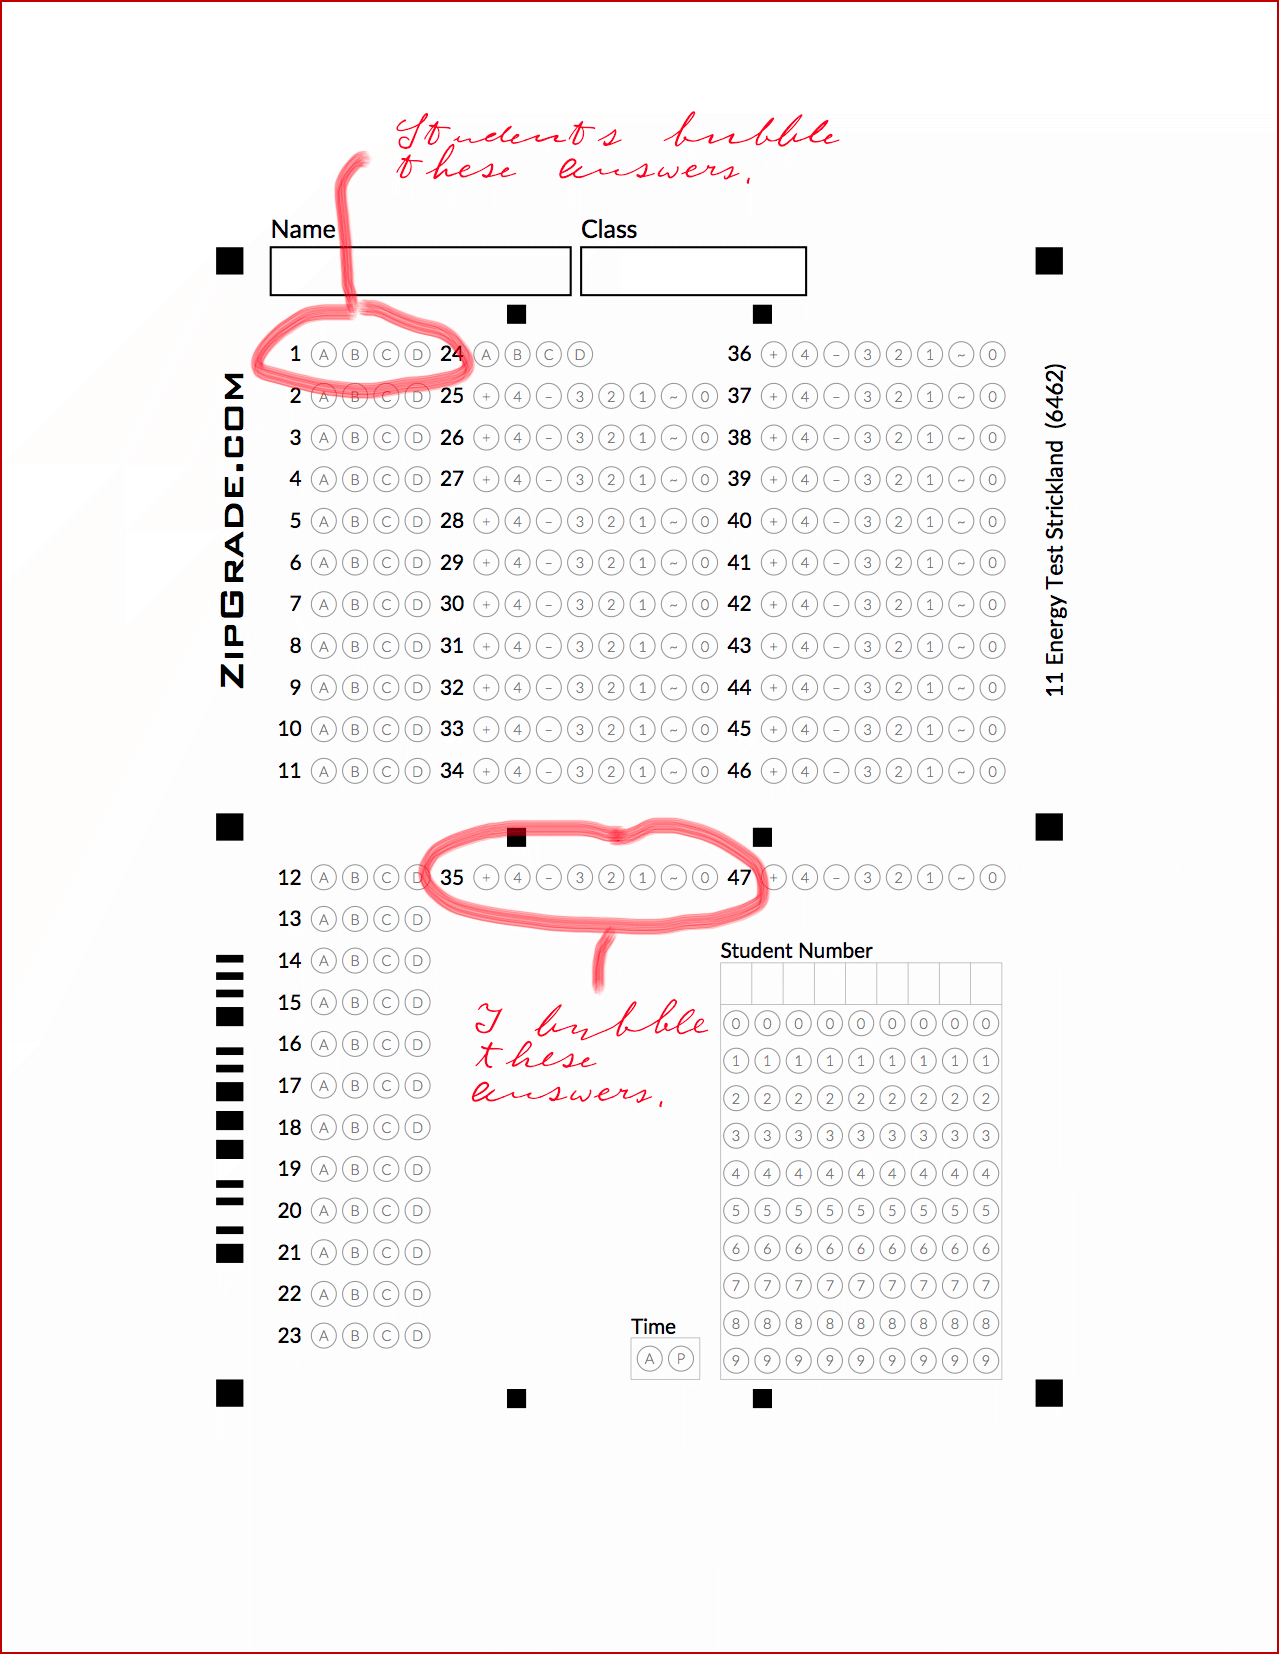 Figure 3: Custom Bubble Sheet
Not only does this save me time (and mistakes) adding up the marks, but I can easily analyse the results. ZipGrade shows me correlations between questions, as well as histograms of responses to each question. I can easily see, for example, how well they are doing on the force diagram questions (as long as I have separated the force diagram from other diagrams). ZipGrade has the ability to add tags to questions, which you can use to do more correlations — such as curriculum expectations — but I haven’t explored that feature yet. (Waiting for a year when I have fewer than six preps.)
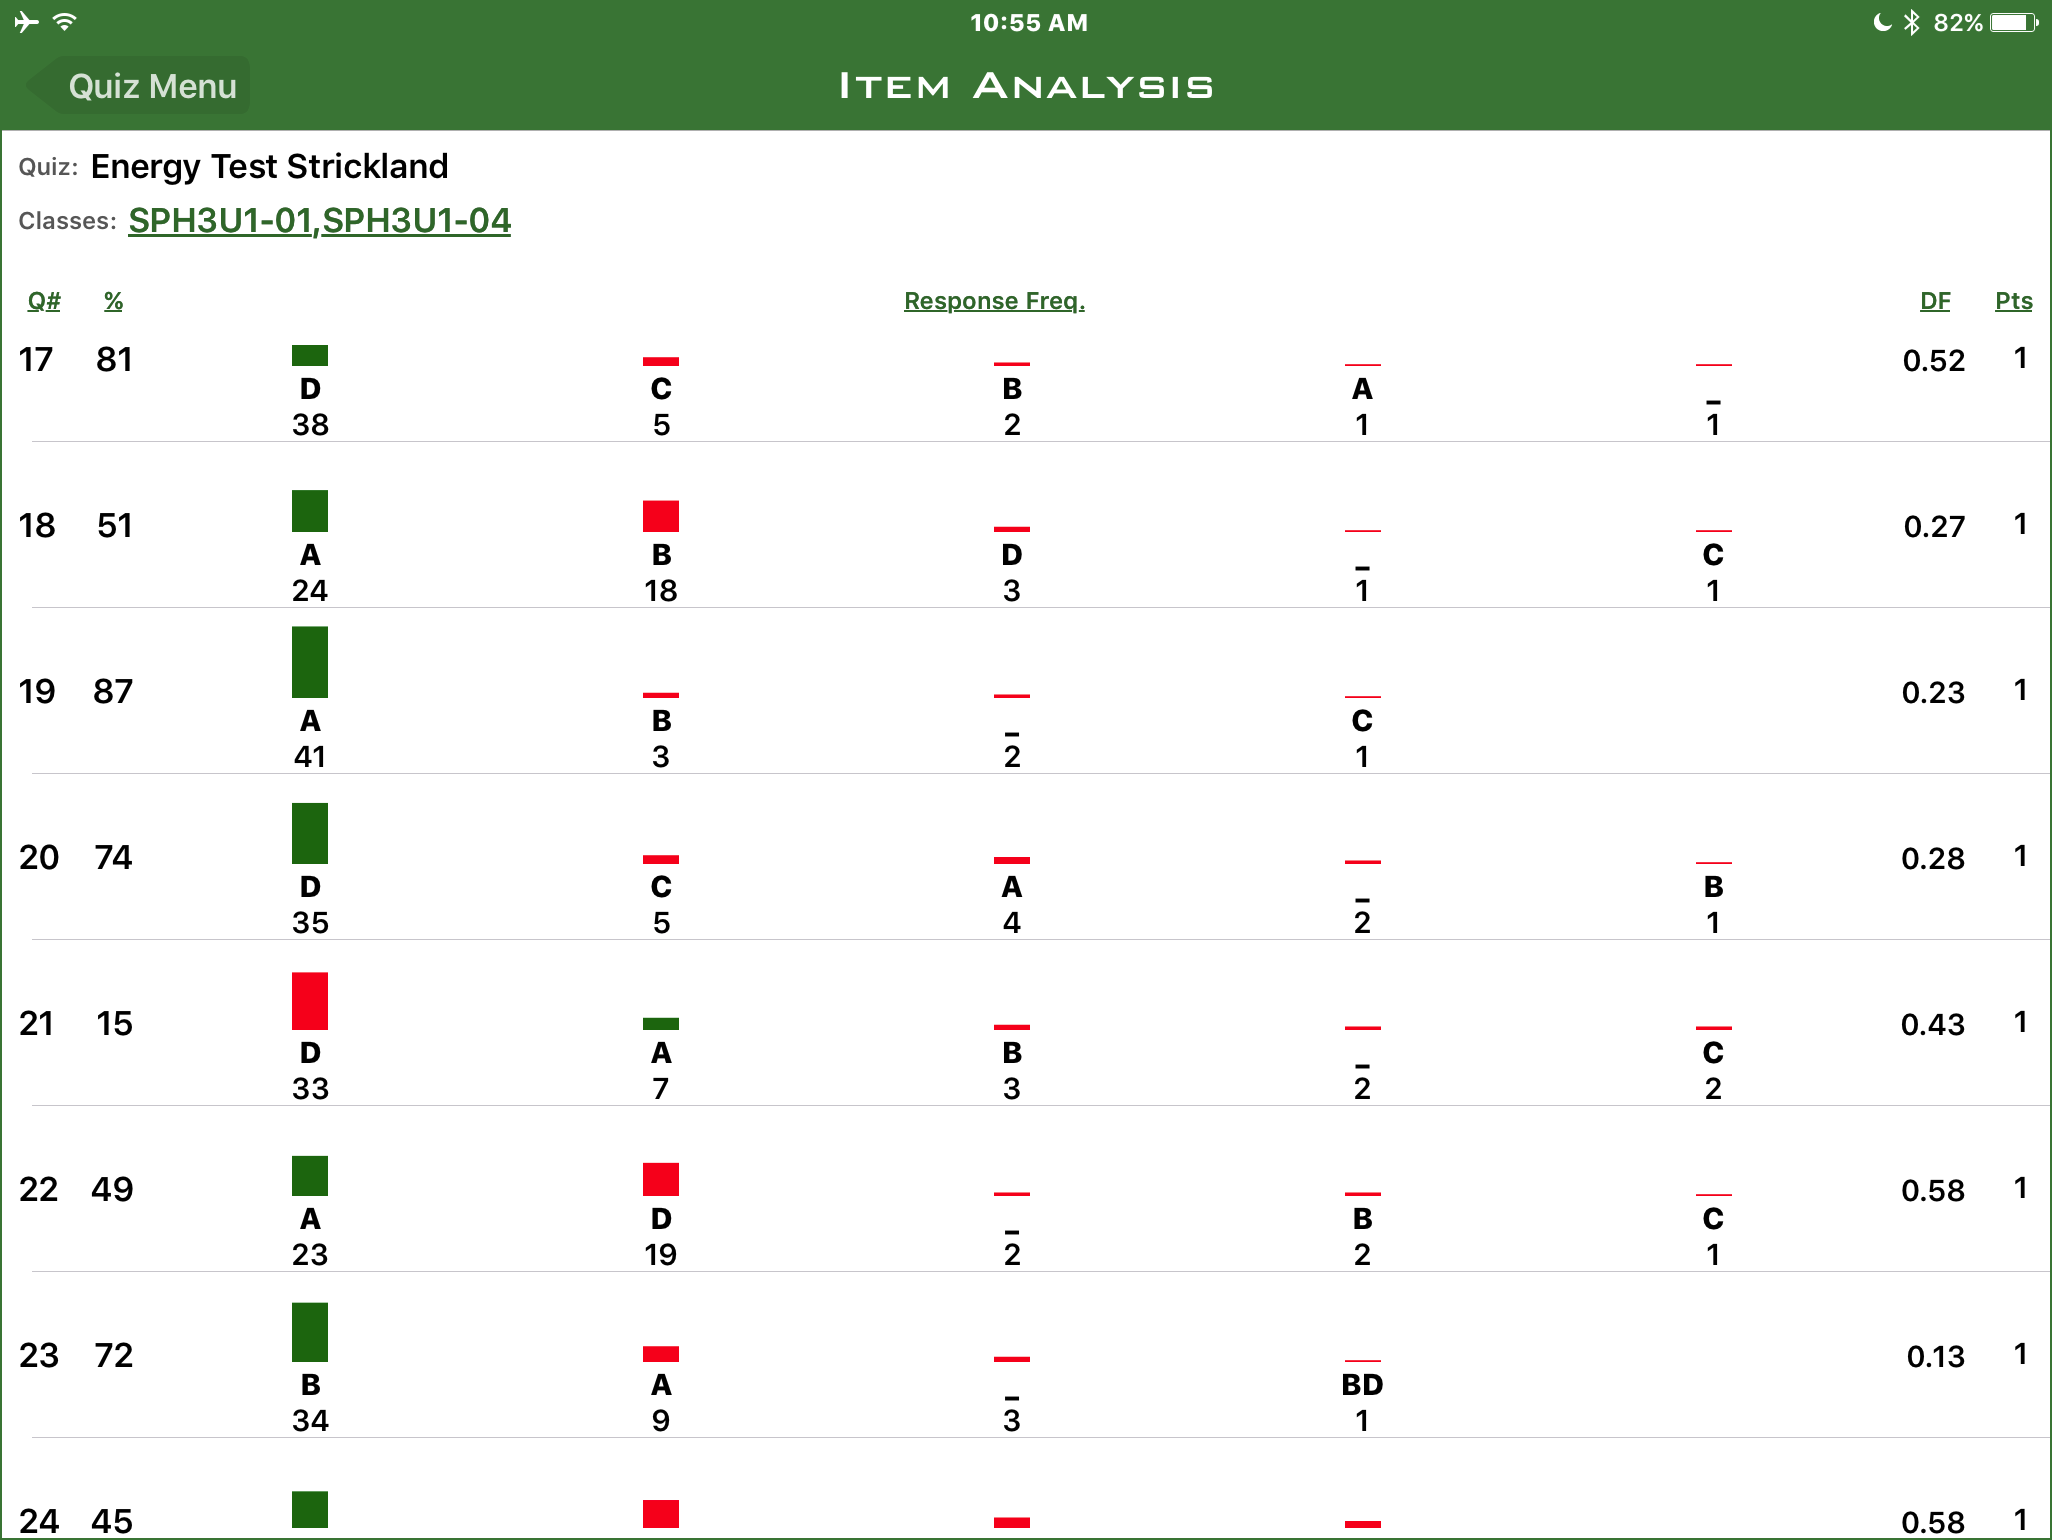 Figure 4: ZipGrade Item Analysis
What do the levels mean?
I currently use eight levels for marking: 4+, 4, 4-, 3, 2, 1, 0+, and 0. This gives me enough granularity that I don’t have to think too long about what level to assign when looking at a response. As a rule of thumb: when in doubt, go for the higher of two levels. In ZipGrade I set the numerical value for each mark using the criteria from
Growing Success, found on page 40.
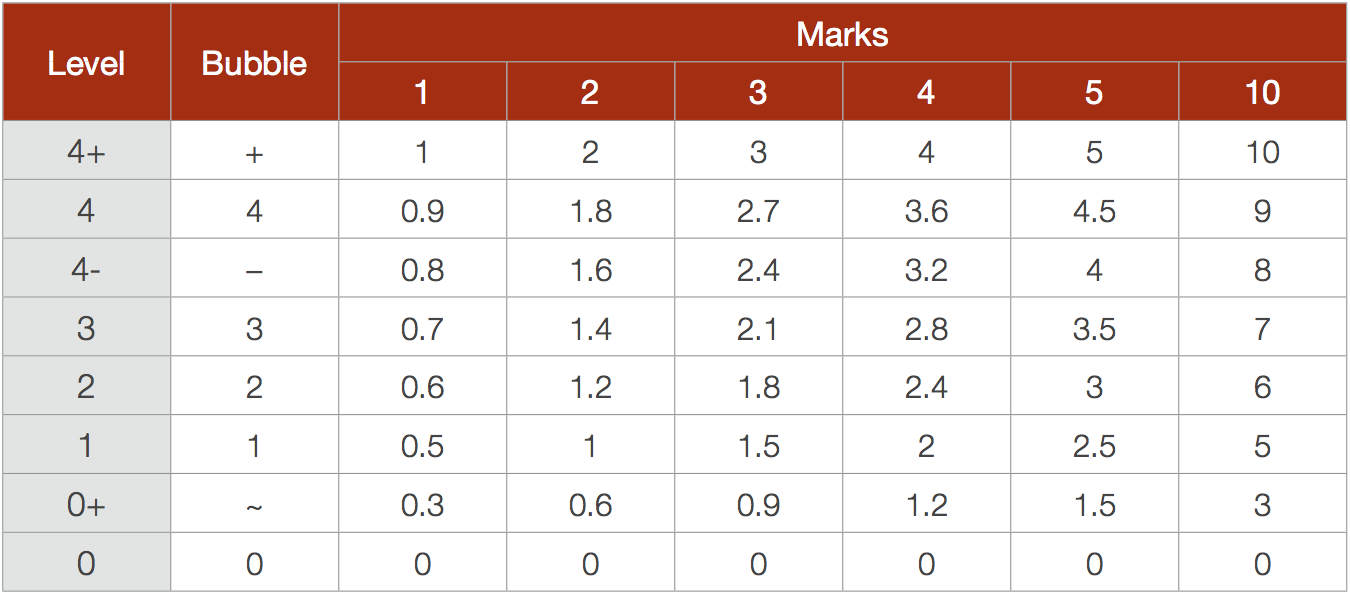 Figure 5: Numerical Values For Levelled Marks
Tags: Pedagogy, Technology